Alert Bot Configuration
Configure a Feishu Alert Bot
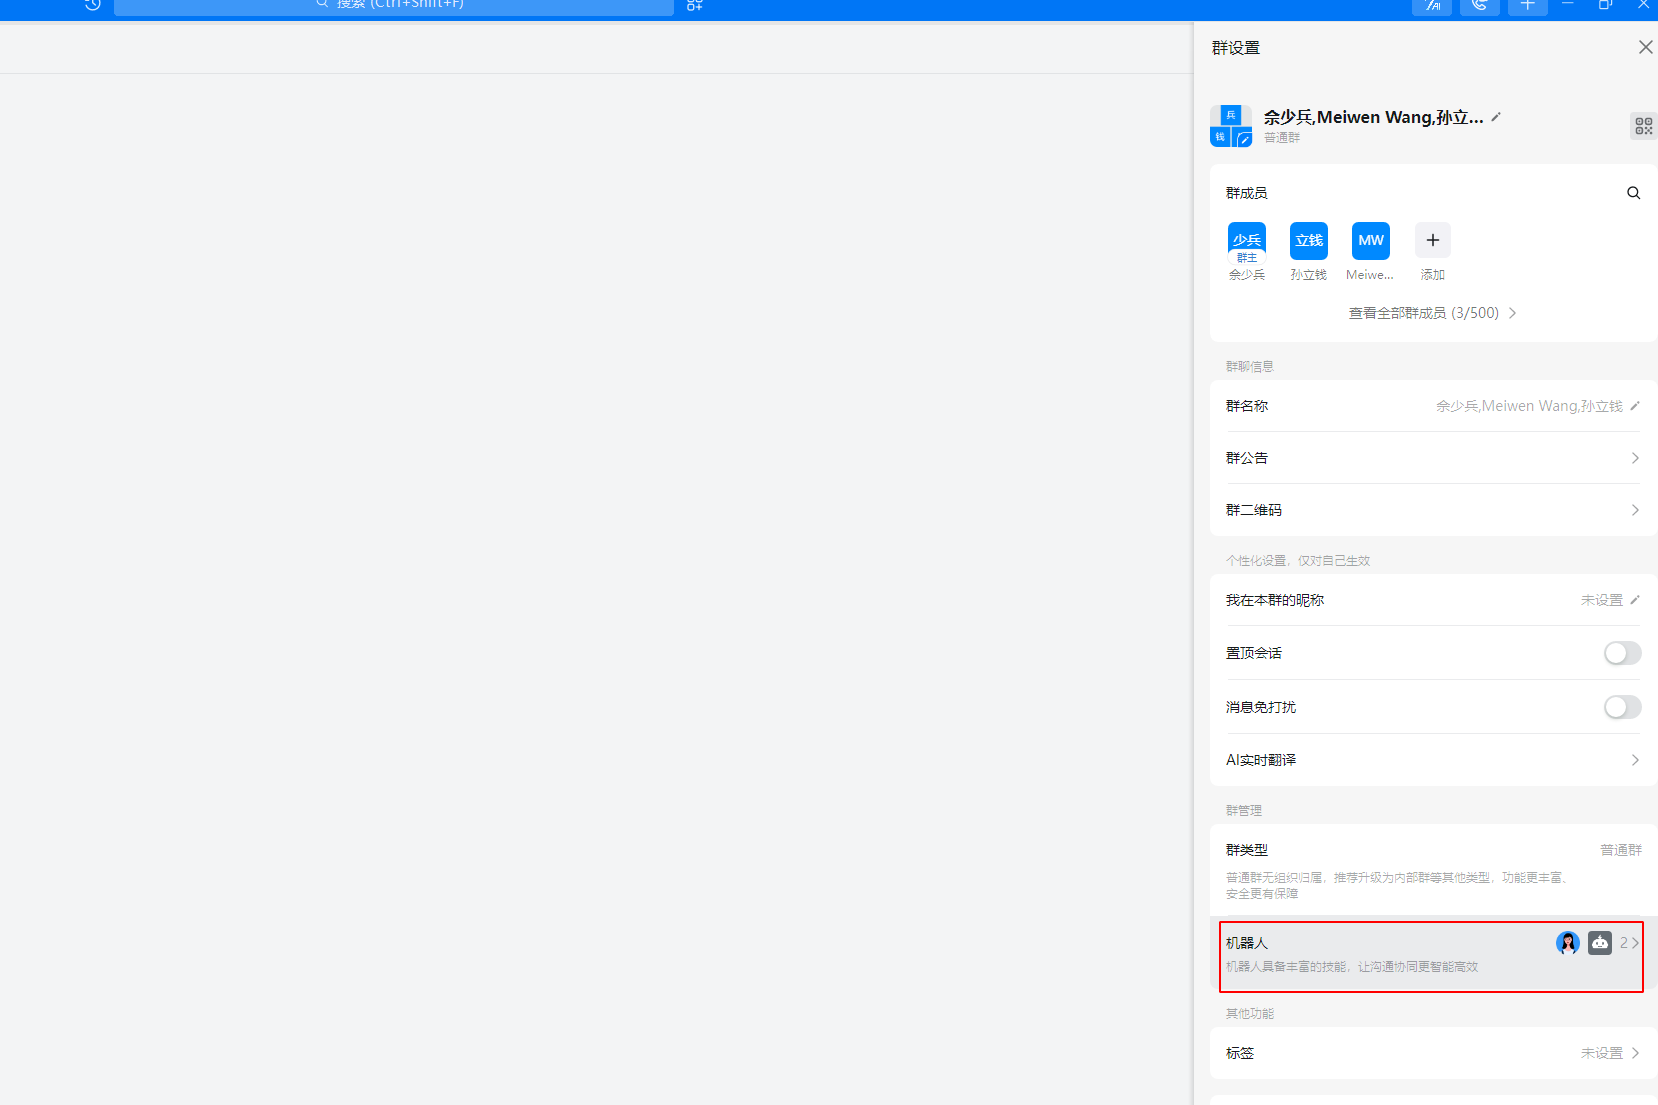
Add a Feishu bot
Follow the document below to add a bot to the Feishu group that will receive alert notifications:
Configure the message template
Follow the document below to configure the message template:
Configure the Message Template
- Select
webhook. See the appendix below for the sample JSON payload.
Parameters:
{
  "status": "firing",
  "alerts": [
    {
      "status": "firing",
      "labels": {
        "strategyName": "111111"
      },
      "annotations": {
        "level": "Notification",
        "resourceType": "FILE_SYSTEM",
        "monitorMetricStr": "Service component equals abnormal",
        "resourceName": "filesystem-1",
        "resourceNode": "head-1",
        "mgmtNode": null,
        "monitorType": "SERVICE",
        "curValue": "0.000",
        "svcName": "slurmdbd"
      }
    }
  ]
}
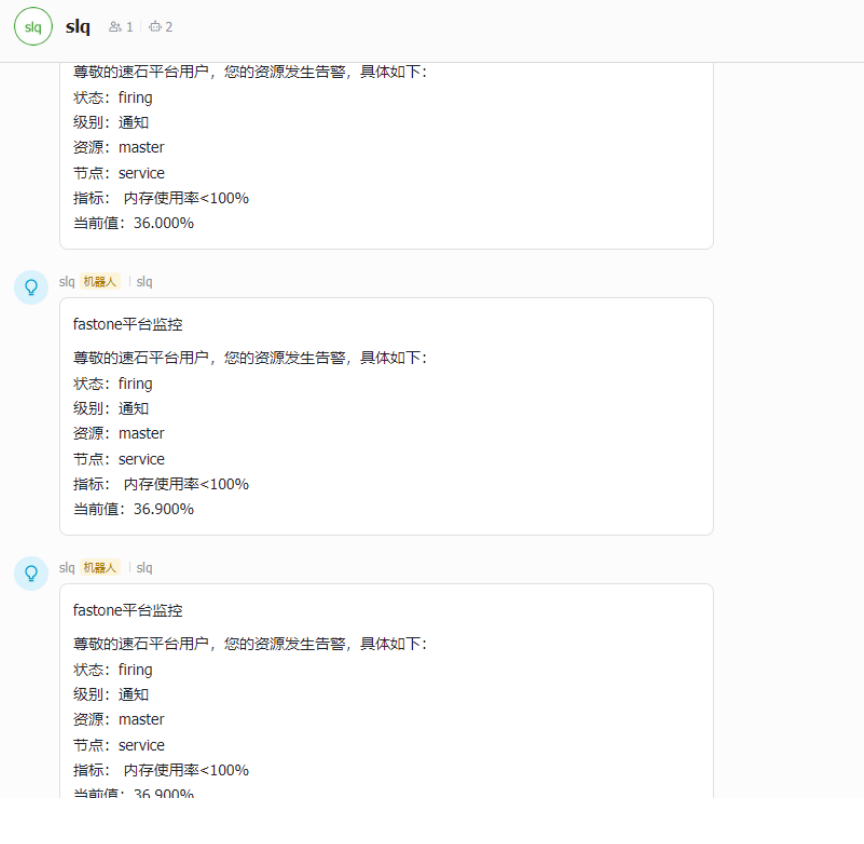
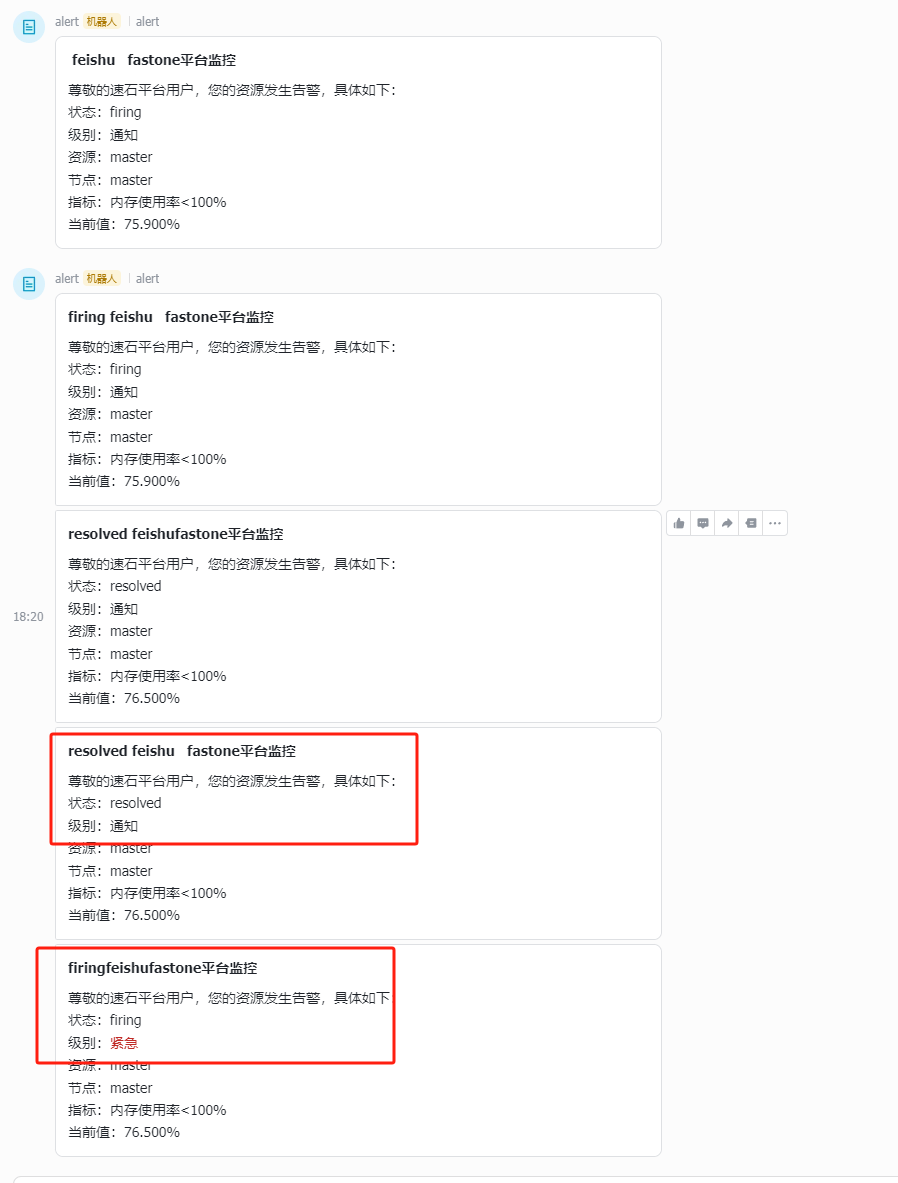
- Customize the bot message.
Set the alert-level color in the notification content.

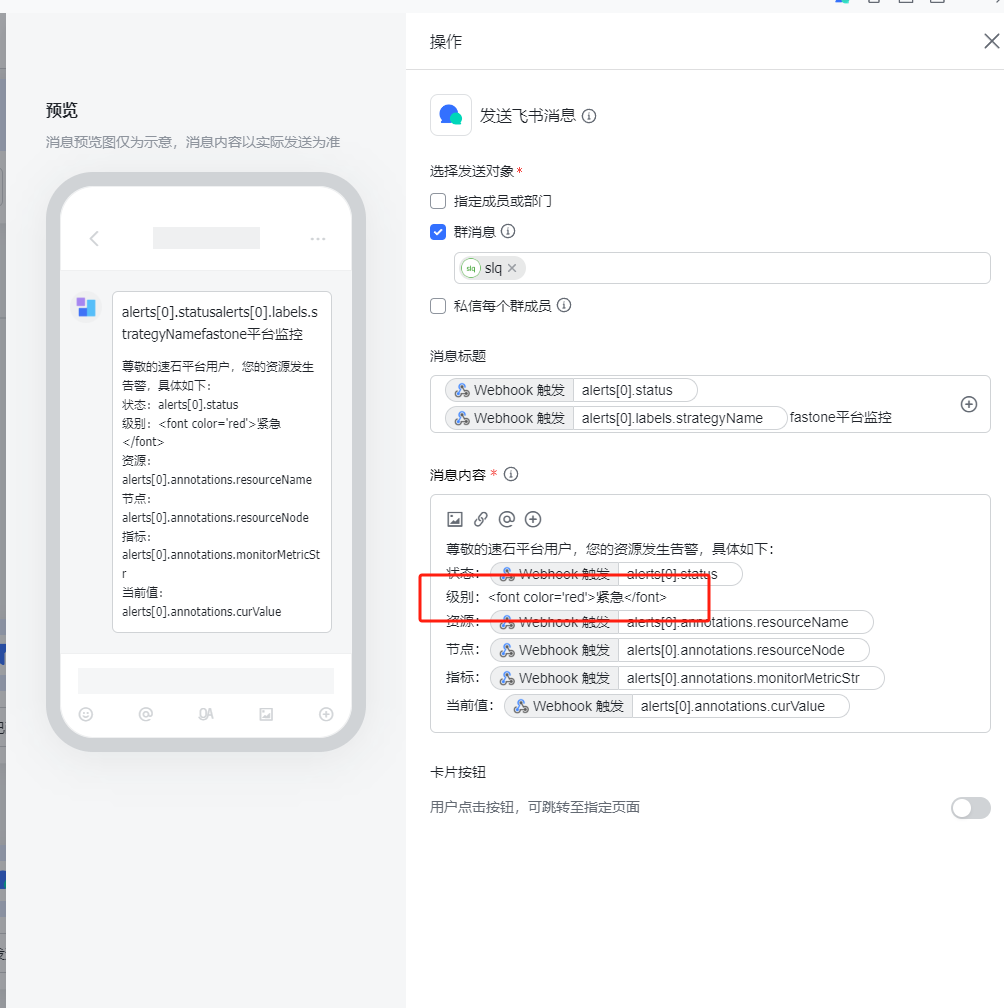
- View the test message.
Appendix
The JSON content used in the message is explained below.
- Alert JSON
{
  "status": "firing",
  "alerts": [
    {
      "status": "firing",
      "labels": {
        "strategyName": "111111"
      },
      "annotations": {
        "level": "Notification",
        "resourceType": "FILE_SYSTEM",
        "monitorMetricStr": "Service component equals abnormal",
        "resourceName": "filesystem-1",
        "resourceNode": "head-1",
        "mgmtNode": null,
        "monitorType": "SERVICE",
        "curValue": "0.000",
        "svcName": "slurmdbd"
      }
    }
  ]
}
- Recovery JSON
{
  "status": "resolved",
  "alerts": [
    {
      "status": "resolved",
      "labels": {
        "strategyName": "111111"
      },
      "annotations": {
        "level": "Critical",
        "resourceType": "CLUSTER",
        "monitorMetricStr": "CPU usage greater than 100%",
        "resourceName": "clusterAAA",
        "resourceNode": "head-1",
        "mgmtNode": "Fastone-Core",
        "monitorType": "HOST",
        "curValue": "1.0",
        "svcName": null
      }
    }
  ]
}
Format notes: the array represents the alert metrics. If any item in the array has status firing, the top-level status is also firing.
Field descriptions:
status:resolvedorfiring, corresponding to recovery and alertlevel: the alert level shown on the platform page, such as Notification or CriticalresourceType: monitored resource type, such asCLUSTERorFILE_SYSTEMmonitorMetricStr: monitored metricresourceName: monitored resource name, such as cluster name or file system nameresourceNode: node that triggered the alert, usually a node in a clustermgmtNode: platform node, such asFastone-Core,Fastone-Common, orFastone-MonitormonitorType: monitoring category, eitherHOSTorSERVICEcurValue: current value of the monitored metricsvcName: whenmonitorTypeisSERVICE, the service name that triggered the alert, such asslurmdbdornode-exporterstrategyName: strategy name; refer to the alert records page on the platform
Example
The following example shows how to add alert notifications to a Feishu group in Feishu version 6.11.16. If other versions differ, refer to the official documentation.
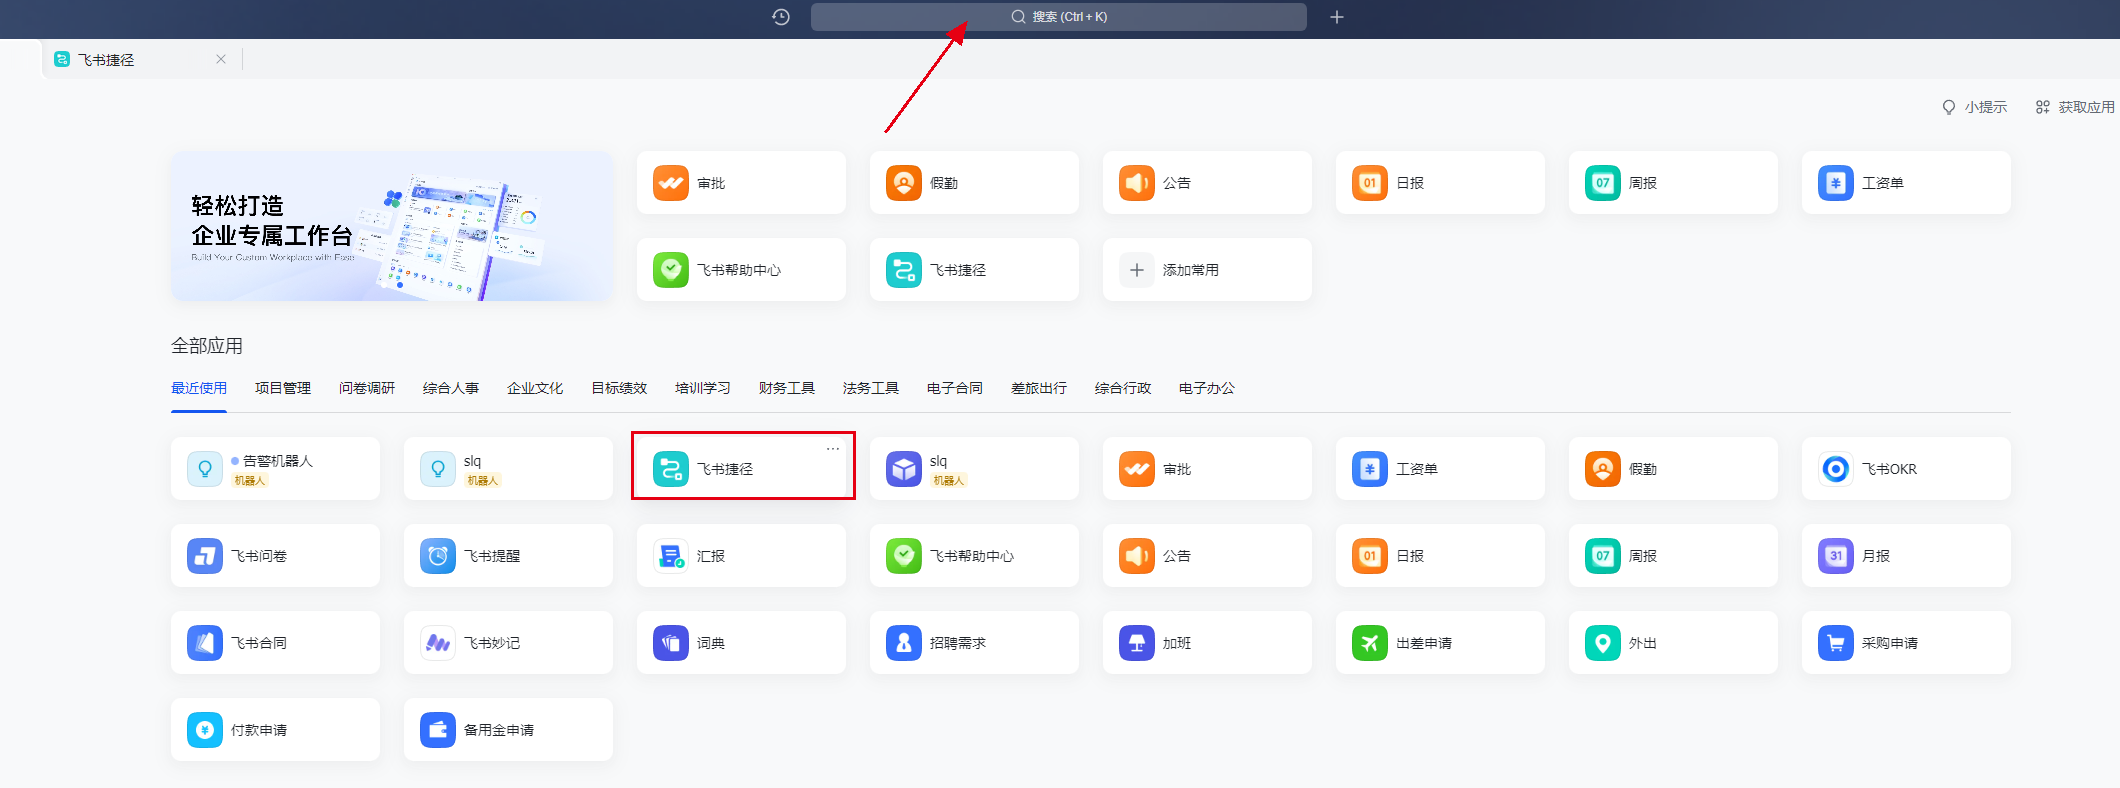
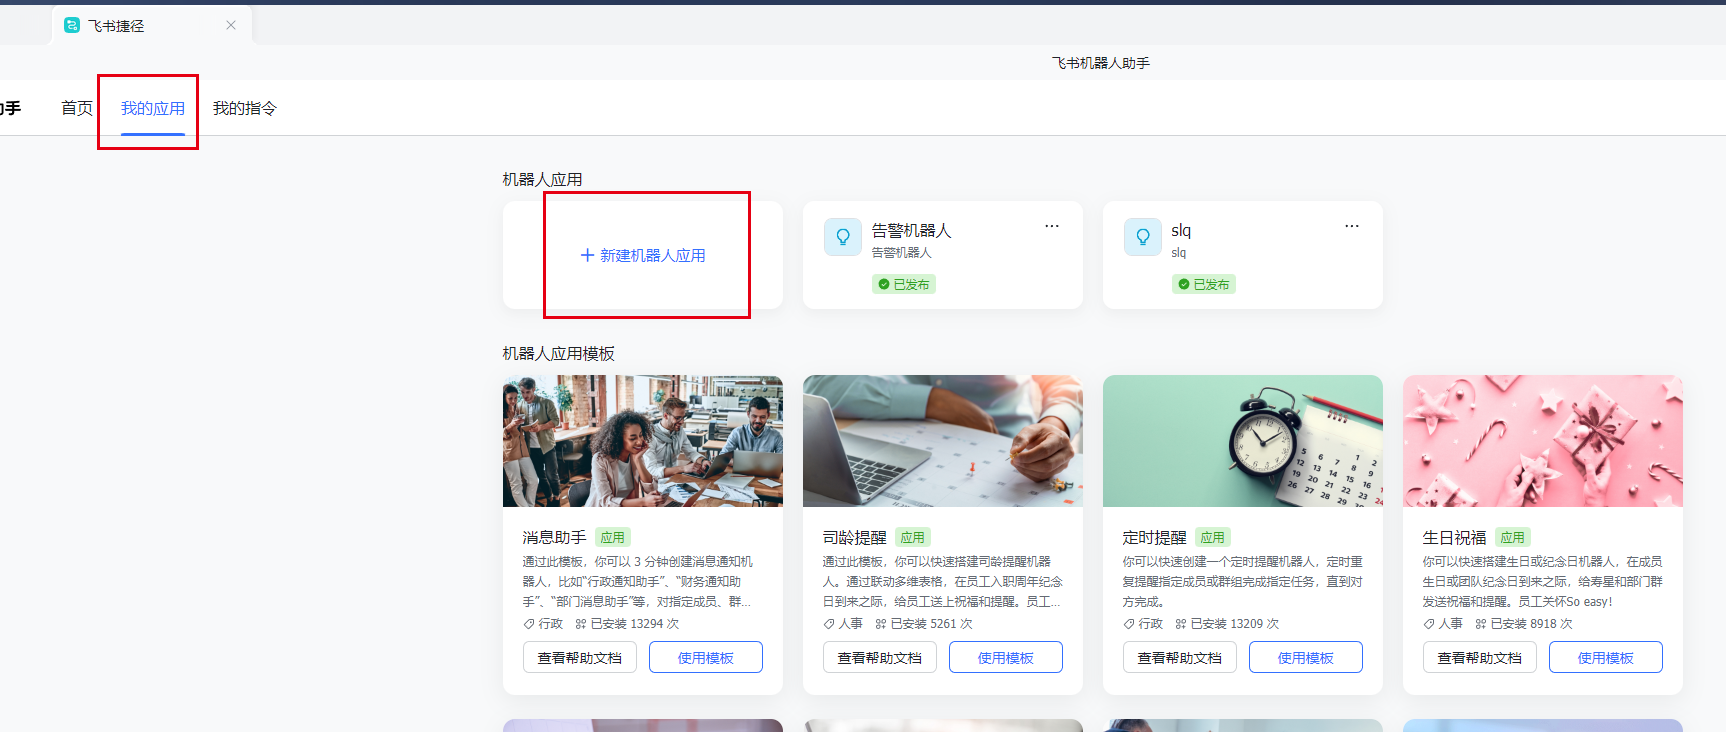
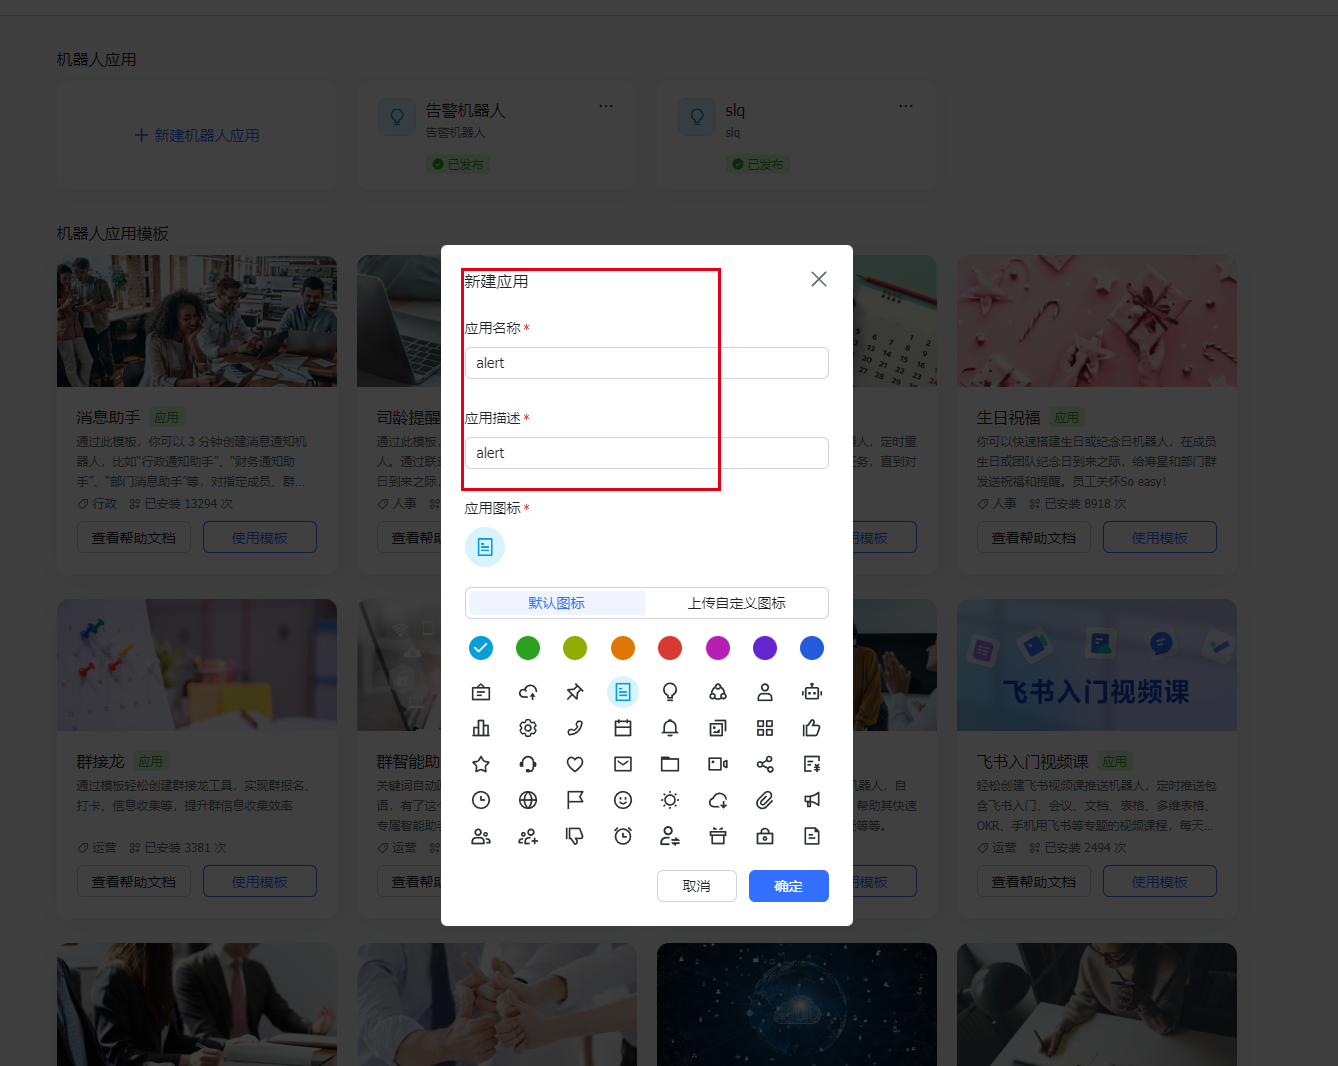
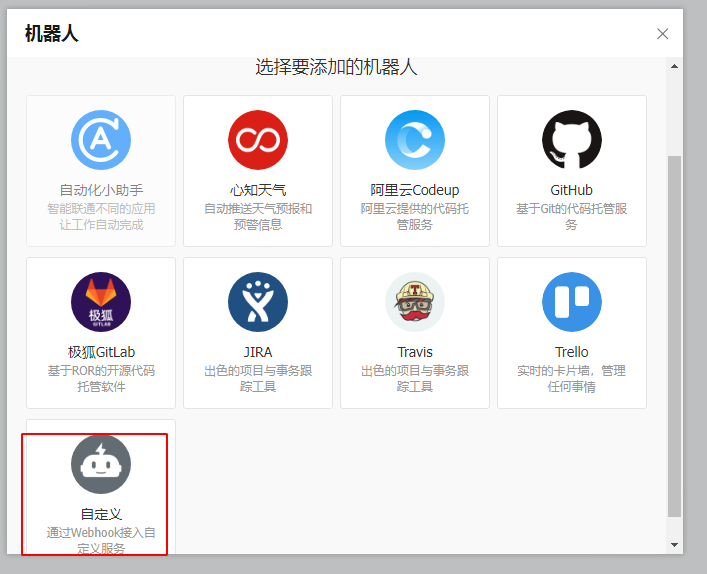
- Find Feishu Automation in Feishu.
- Create a new bot application.
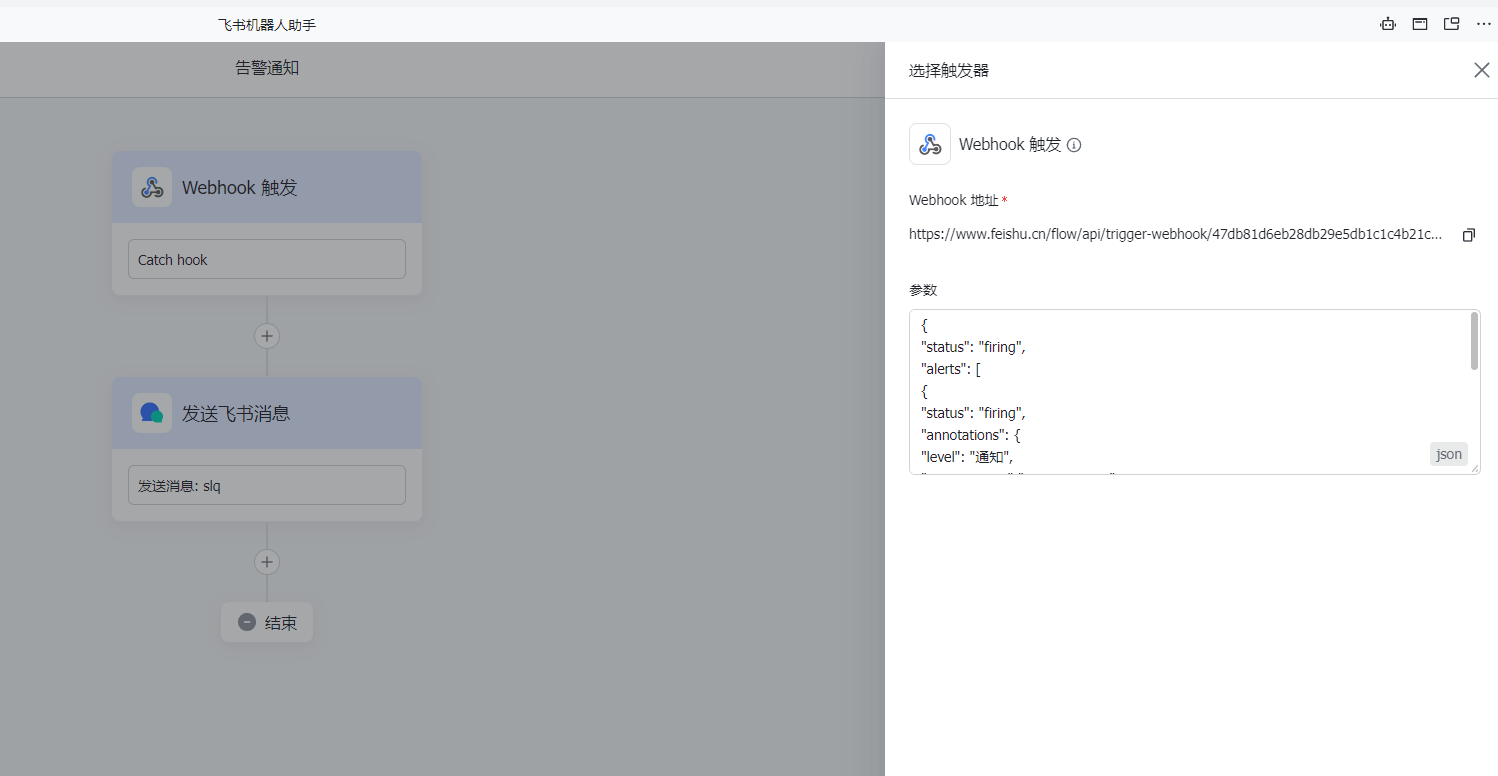
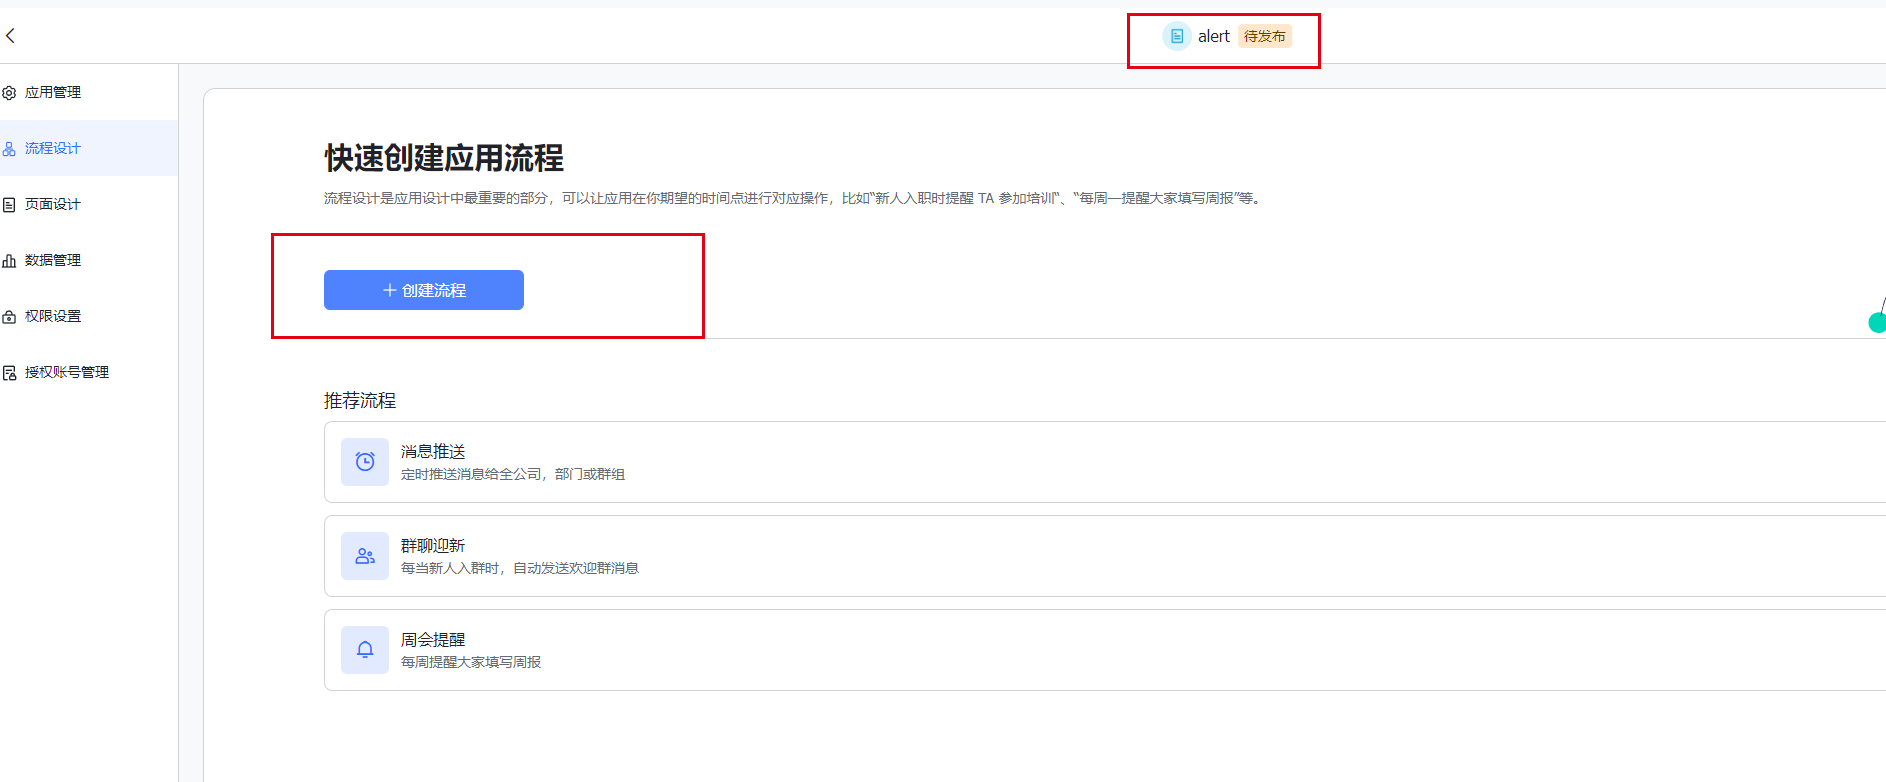
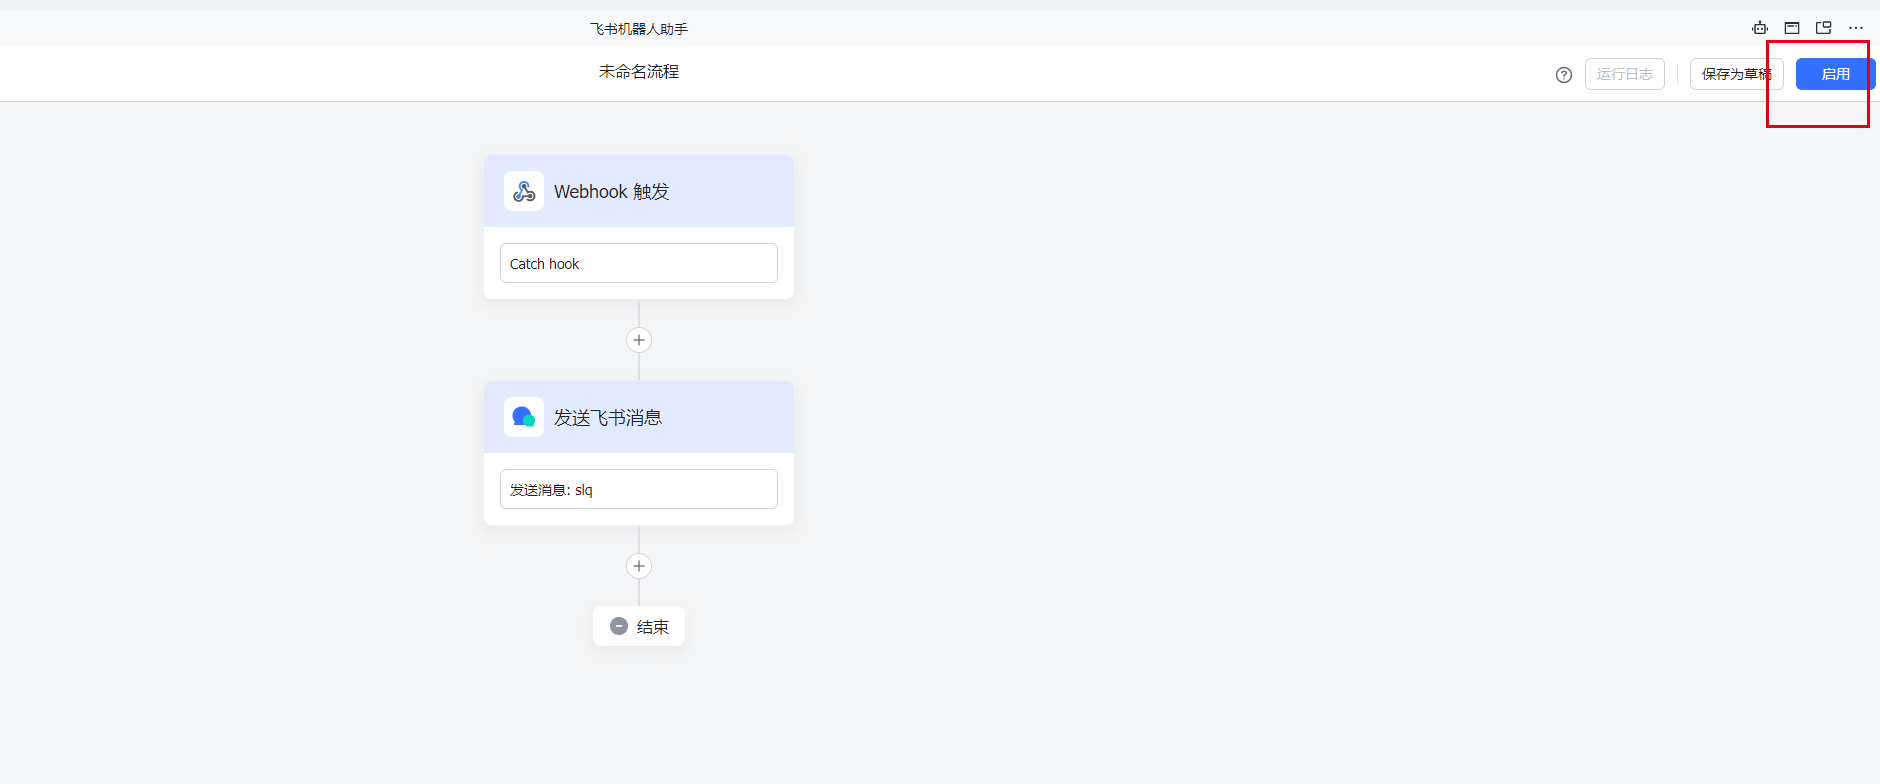
- Create a workflow.
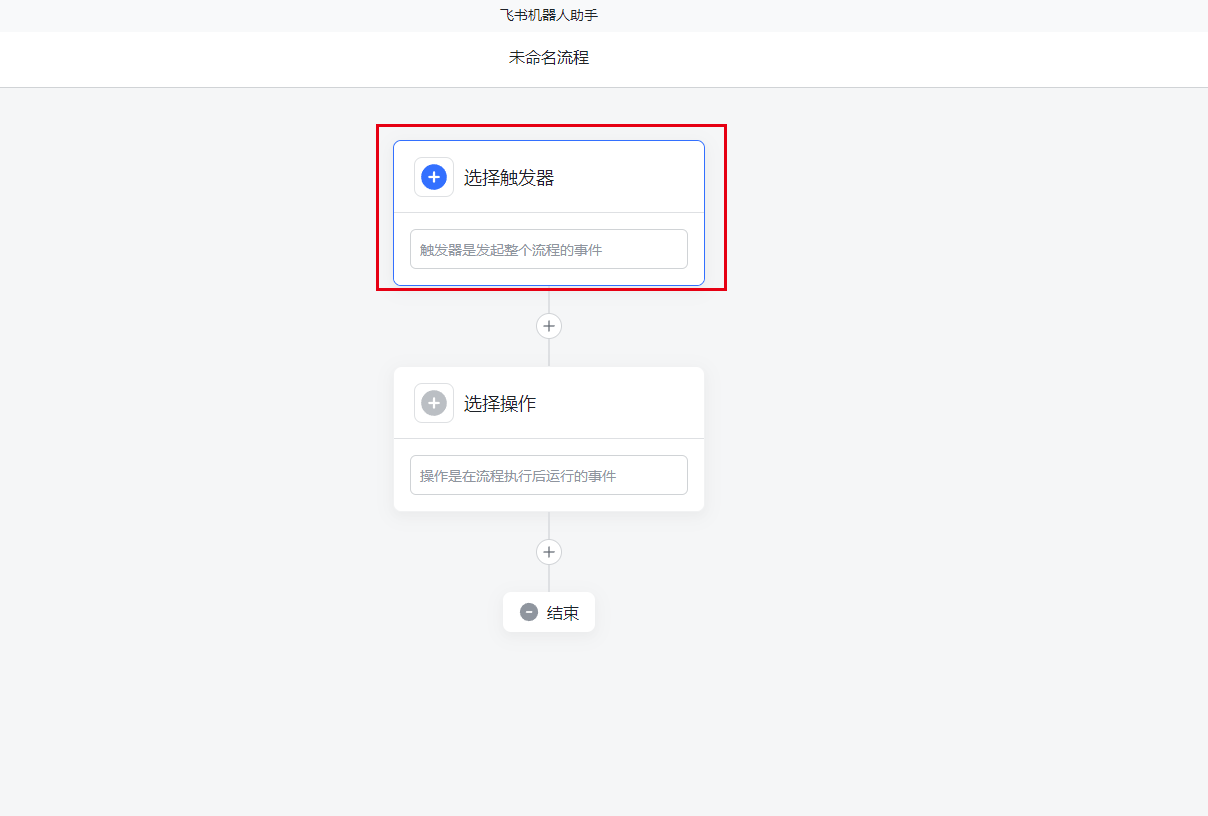
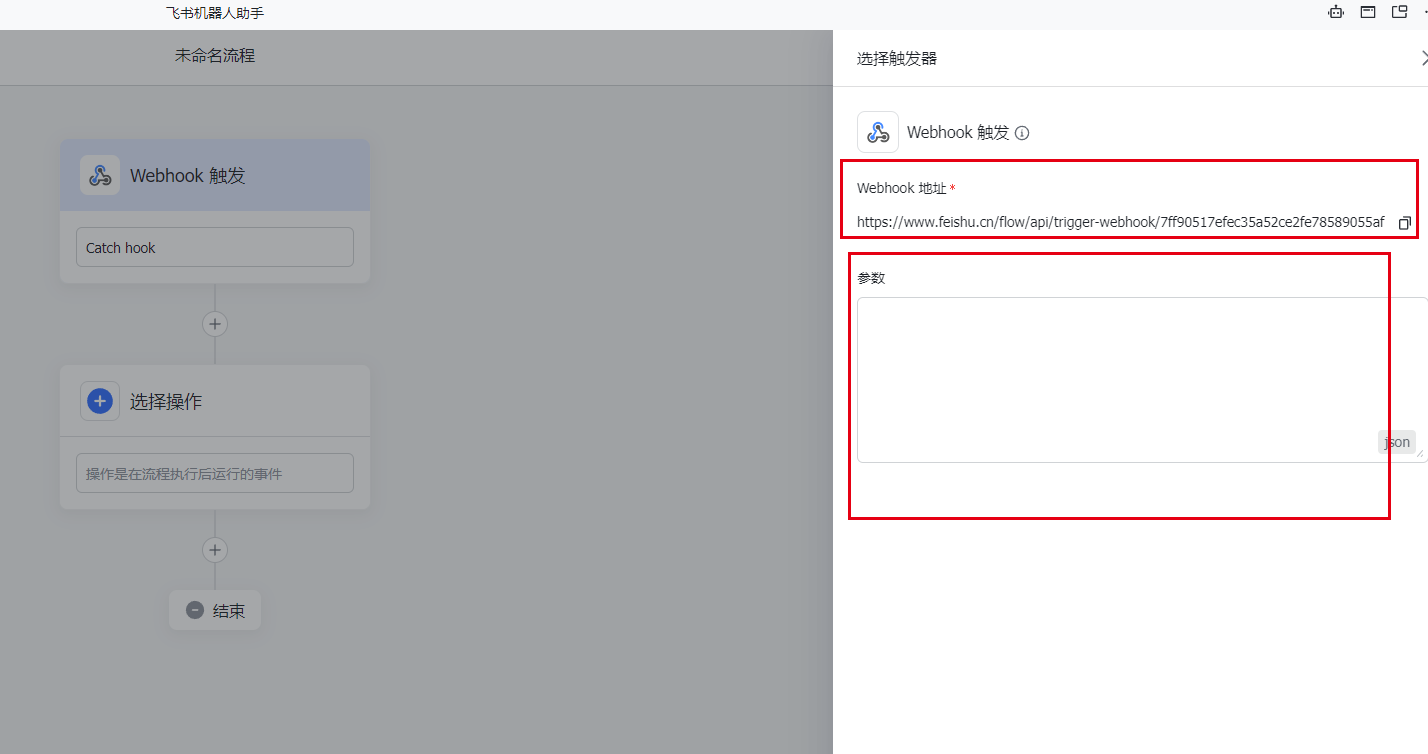
- Create a trigger.
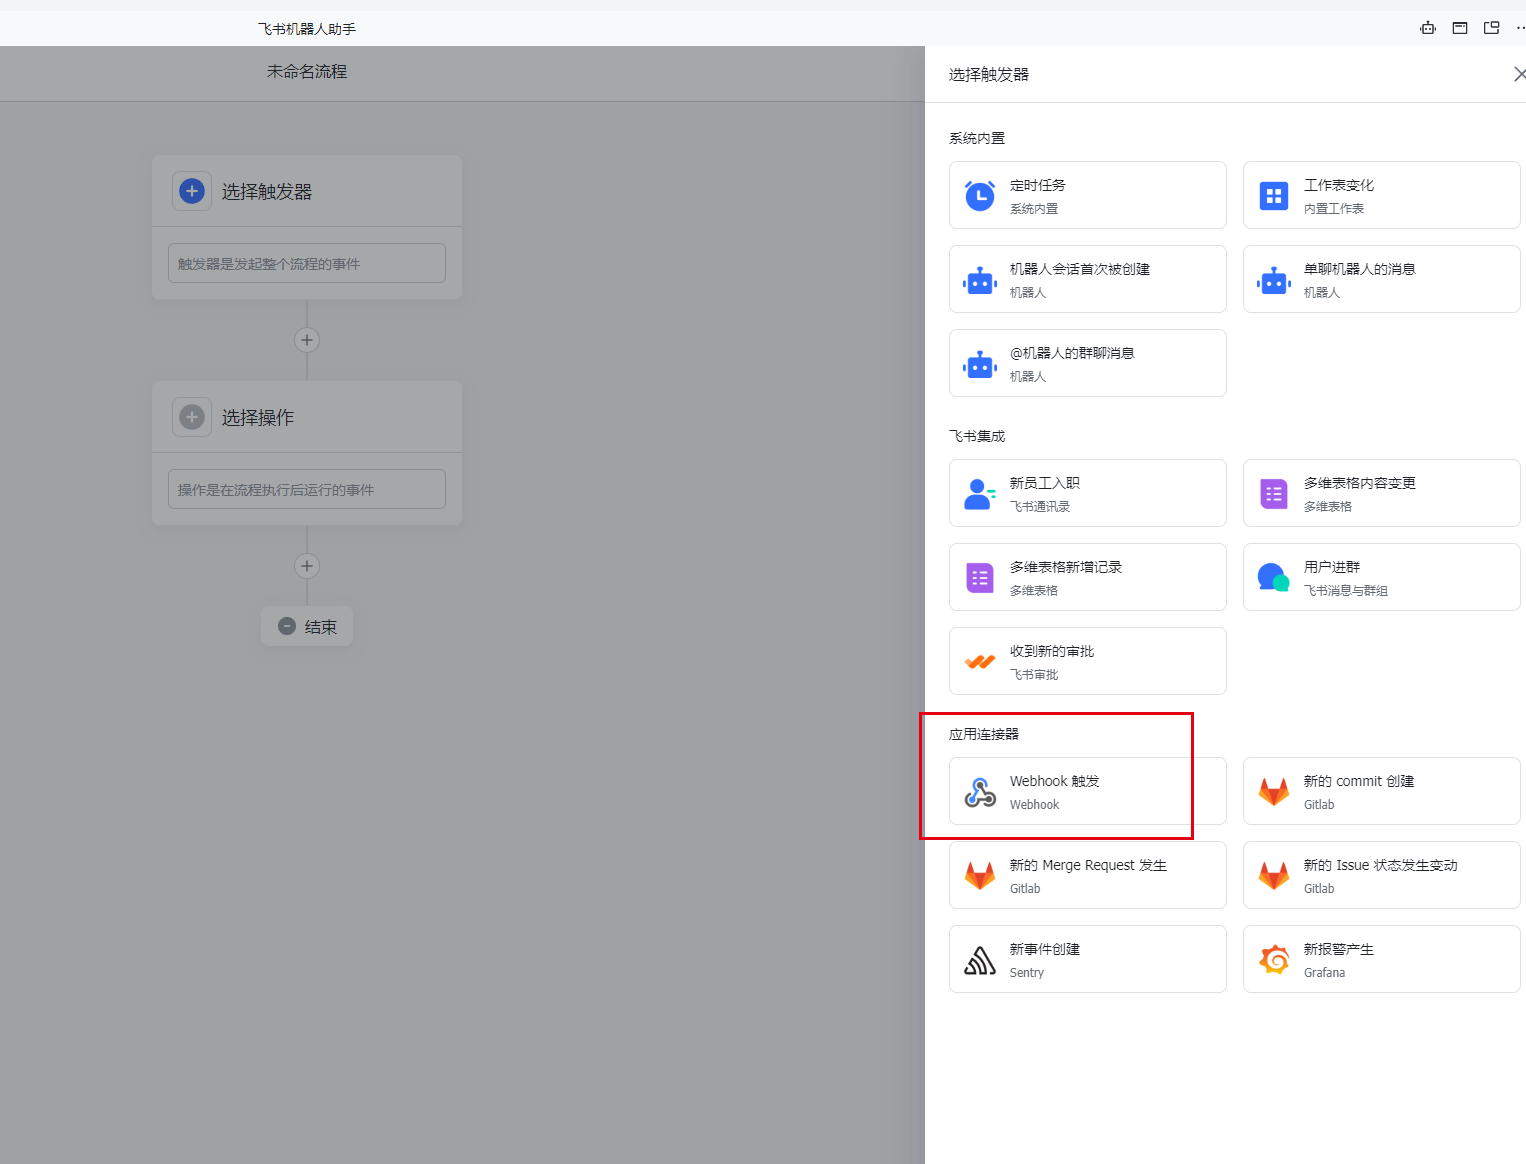
- Select a webhook trigger.
- Enter parameters (see the sample above).
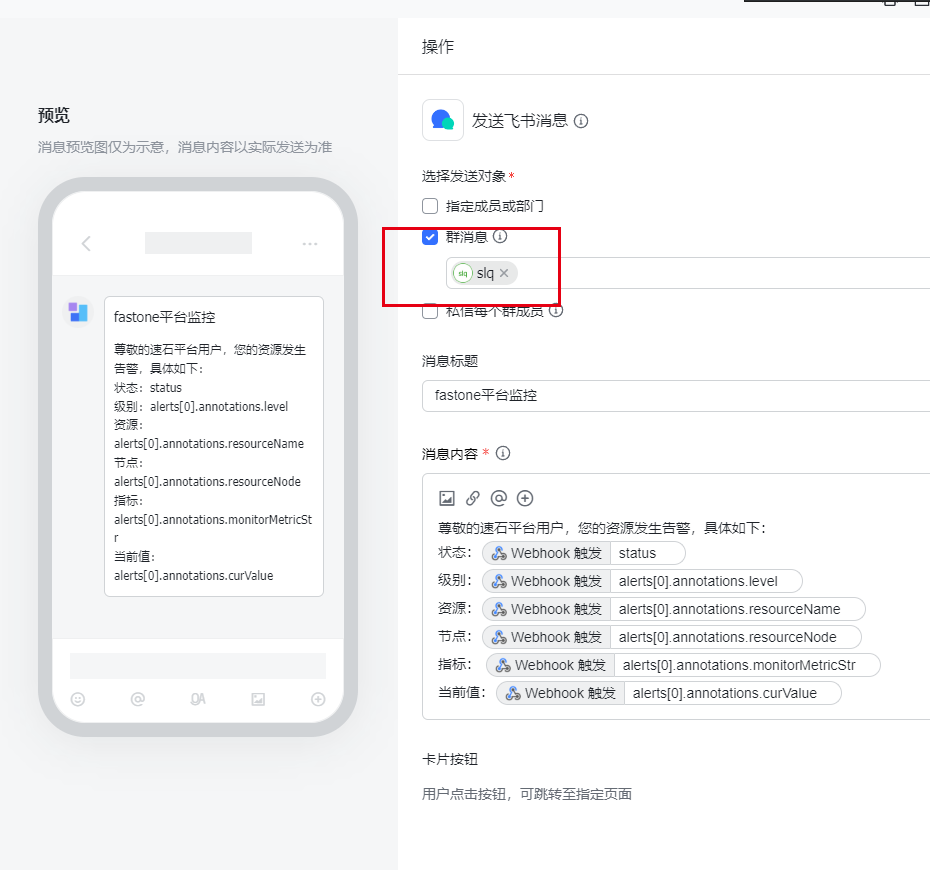
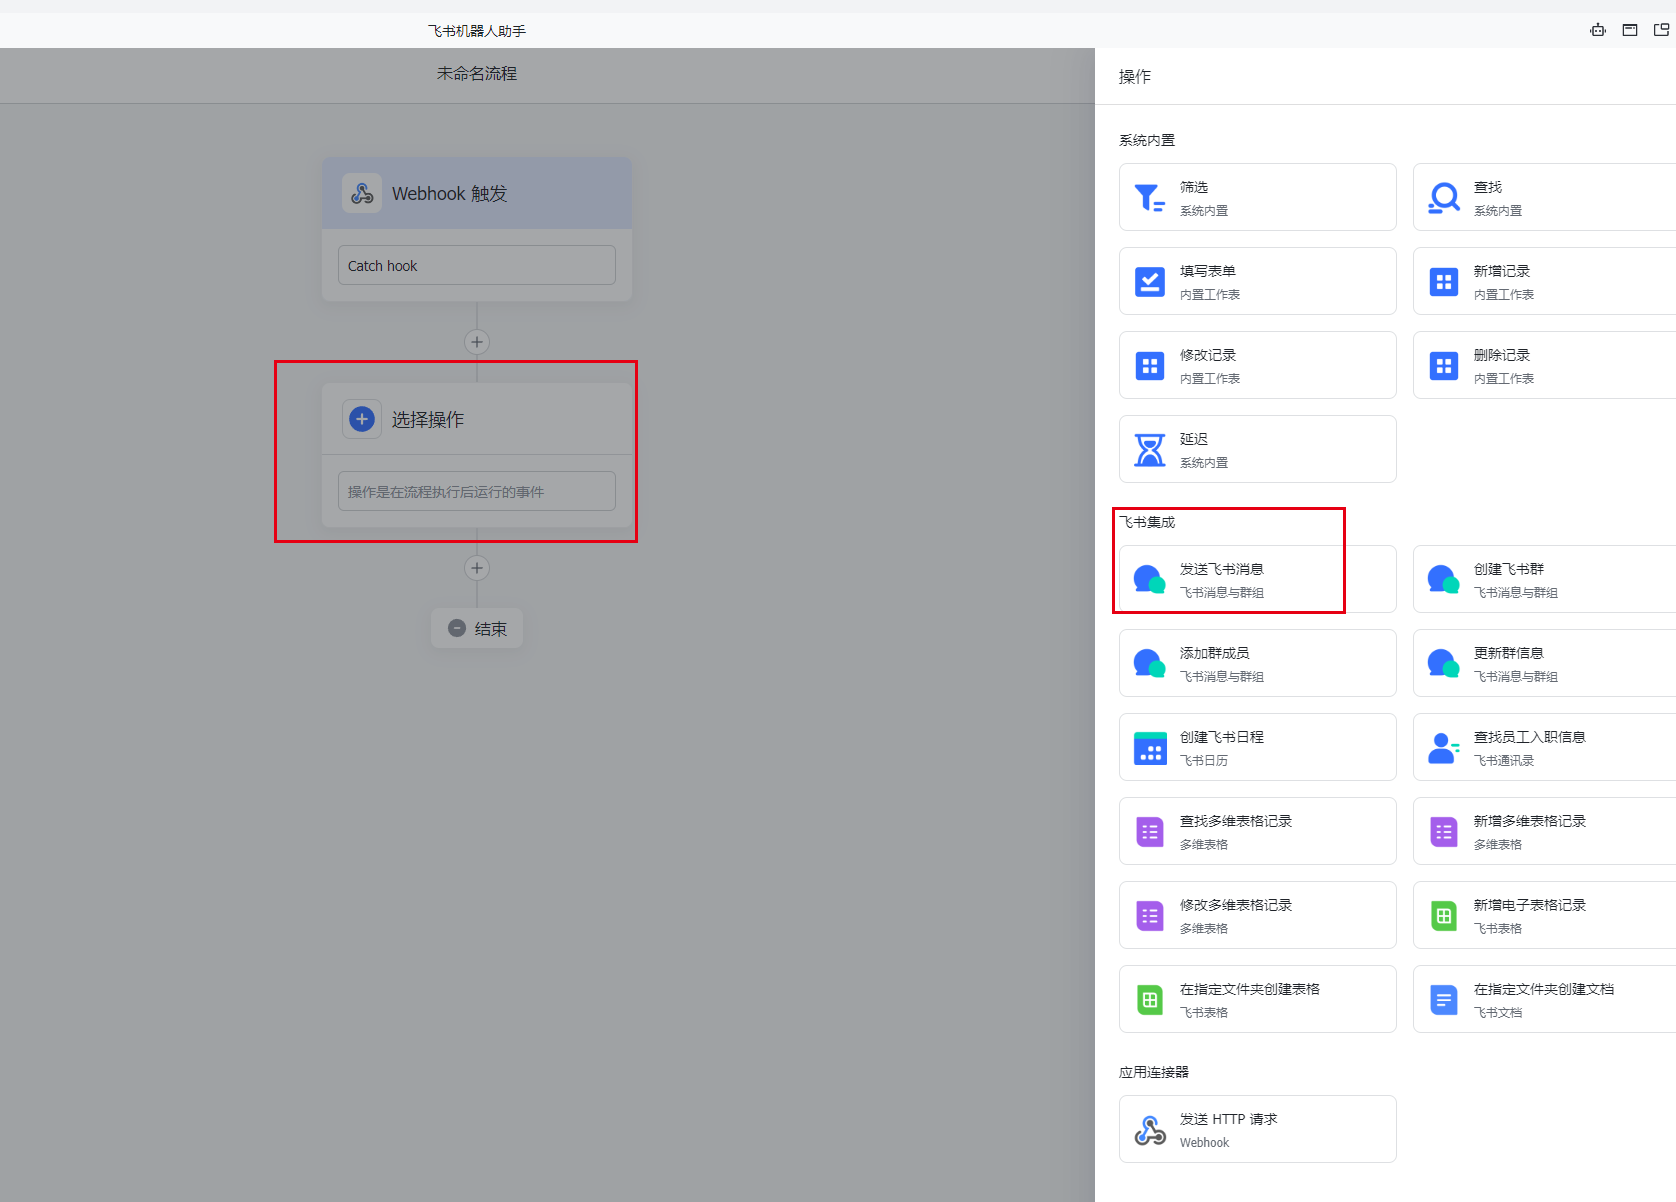
- Select an action.
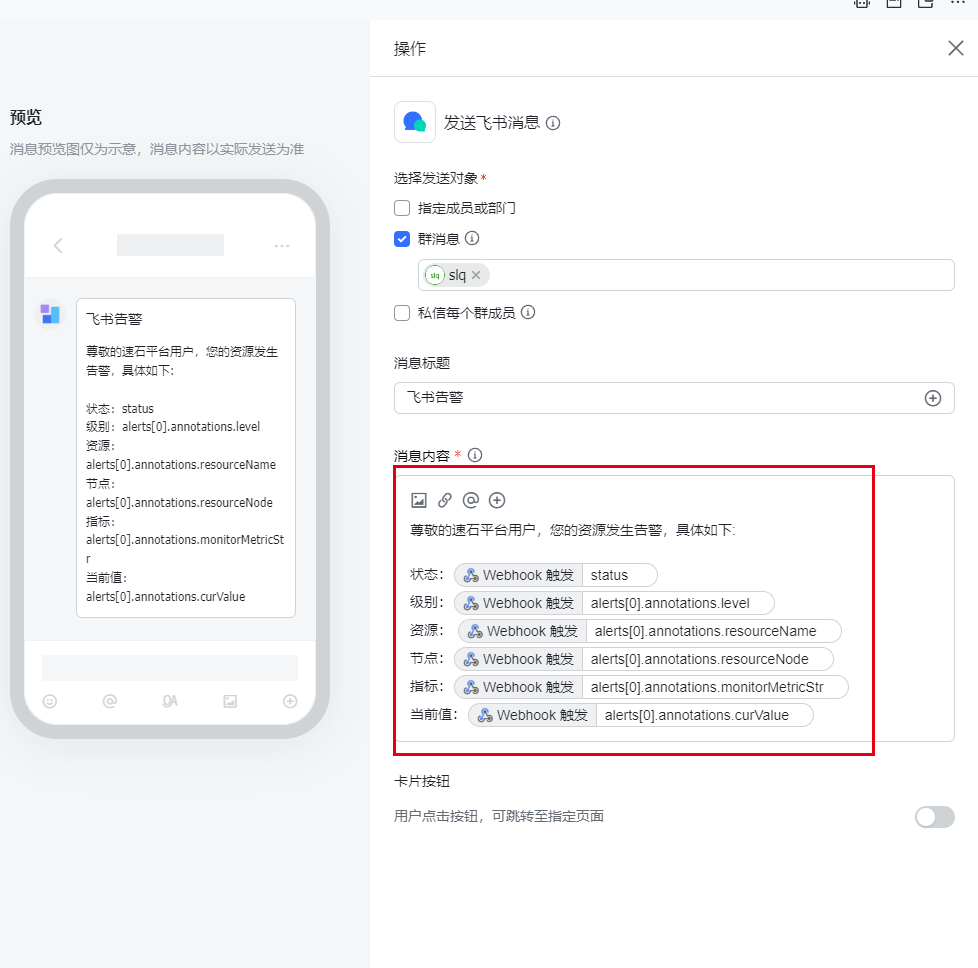
- Set the message content.
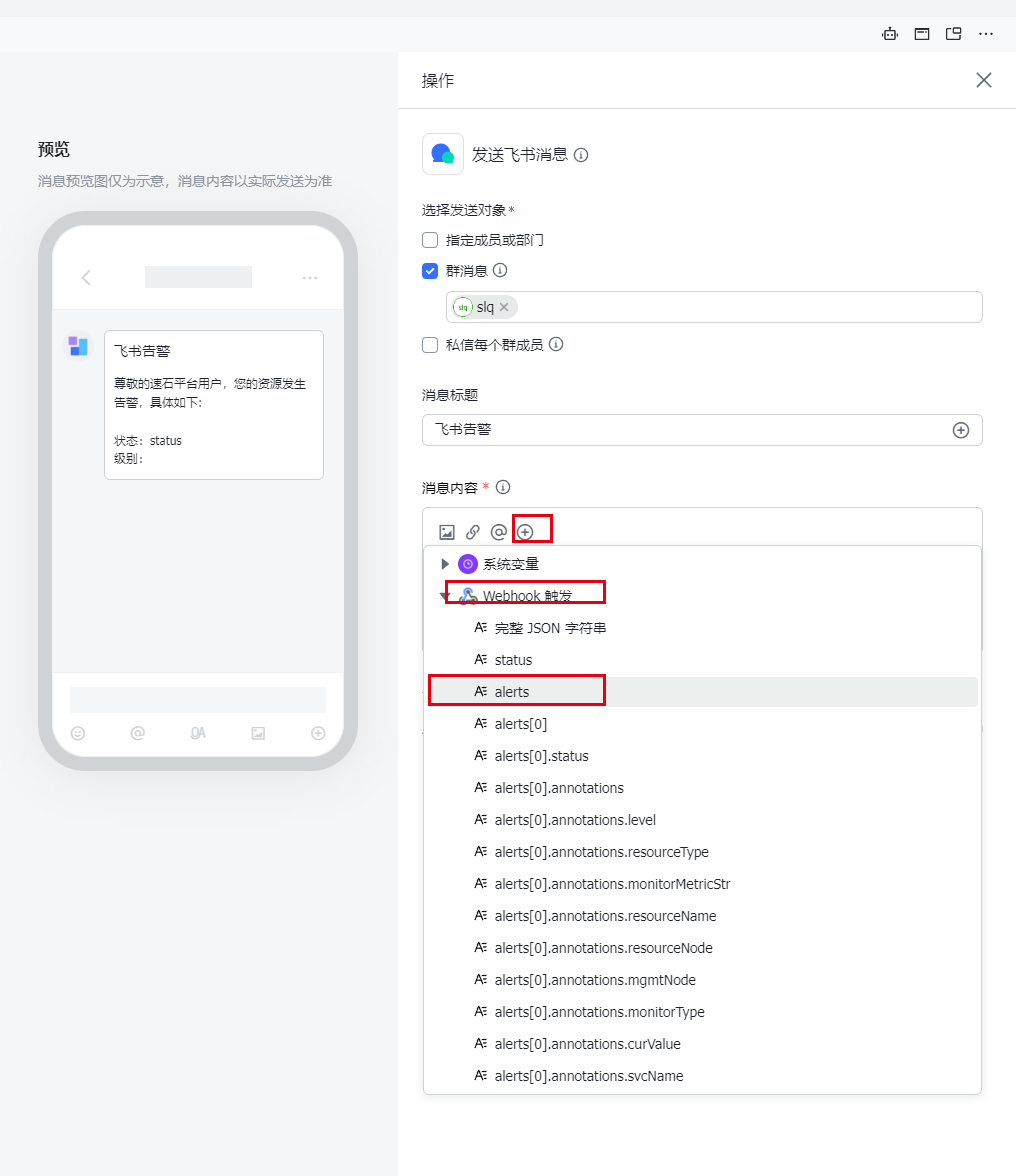
The message content can be adjusted based on the alert policy type.
- Enable the workflow.
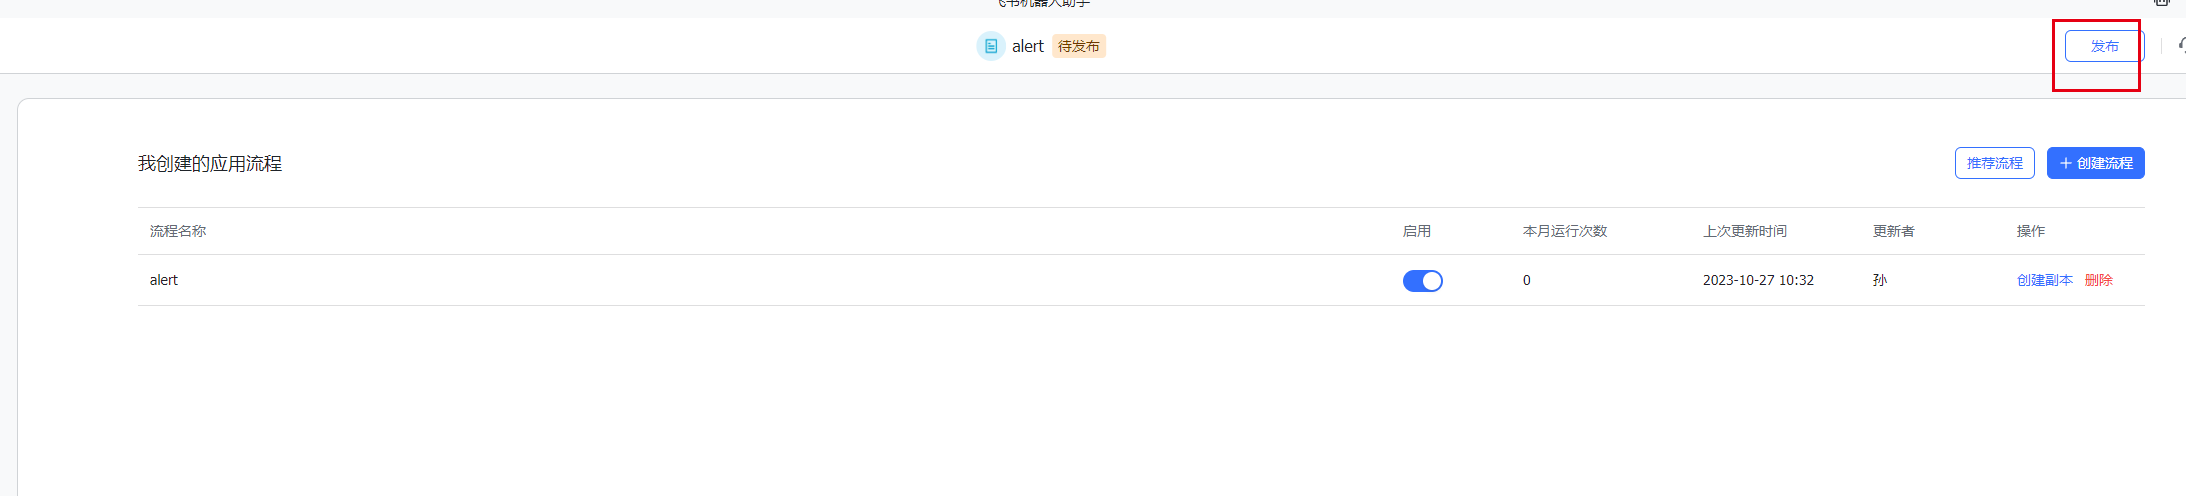
- Publish it.
DingTalk Bot Configuration
1. Add a bot in the group chat
-
Add a bot in the group chat.
-
Select custom service integration via webhook.
2. Configure the bot
- Customize the name.
- Enable message push.
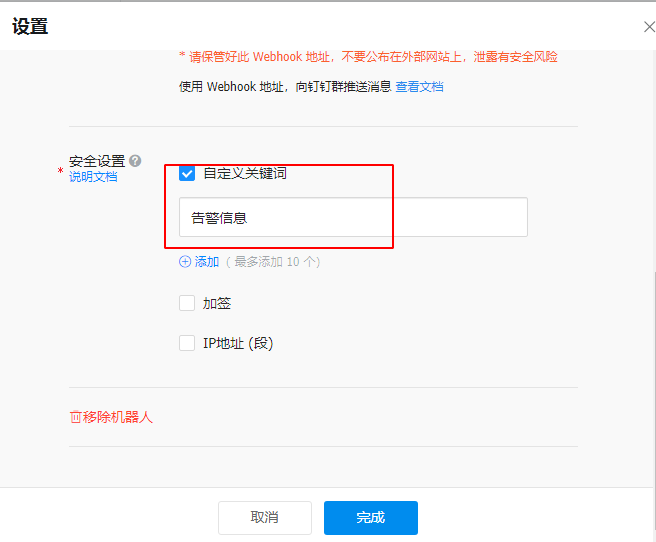
- Under Security Settings, choose Custom Keyword.
Enter the keyword:
Alert Information