FCP-Suite Monitoring Architecture
Monitoring Architecture
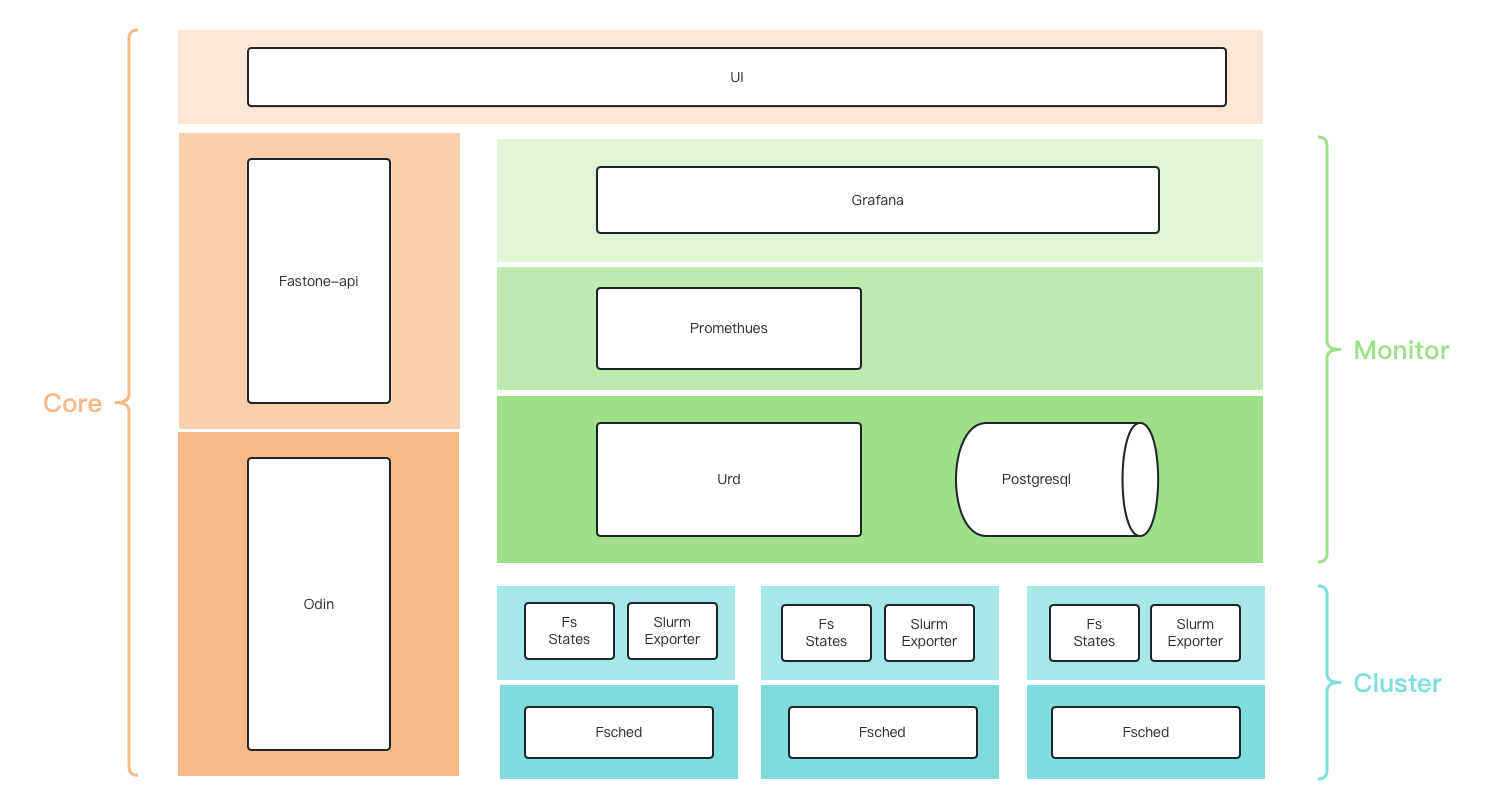
Data Flow
fs-states-svc: periodically caches jobs from Slurm according to defined rules.urd: synchronizes jobs from thefs-states-svcservice on the head node of each cluster and stores them in the database.prometheus:- periodically scrapes data from
urd - periodically scrapes data from
slurm-export
- periodically scrapes data from
grafana: connects toprometheusand theurddatabase to display data.
fs-states-svc
It queries the Slurm API, which is equivalent to:
squeue,scontrolsacct
Urd
Tables
clusters: cluster table, synchronized from odinhead_nodes: head node table, synchronized from odinjobs: job table, synchronized fromfs-states-svcuser_usages: usage table for clusters, partitions, and users. This stores periodically aggregated data calculated fromjobs.usage: actual CPU usagereq_usage: requested CPU usage- Daily growth may reach
max(partitions) * max(users), so monthly partitioning is planned.
user_usages
Data Tables
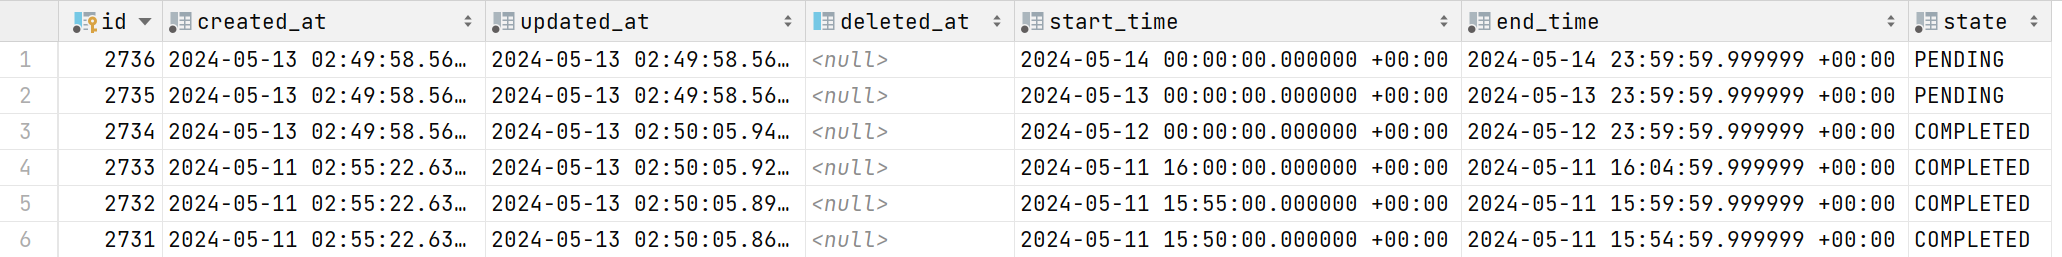
time_records    time-slice table
    start_time    slice start time
    end_time      slice end time
    state         slice status
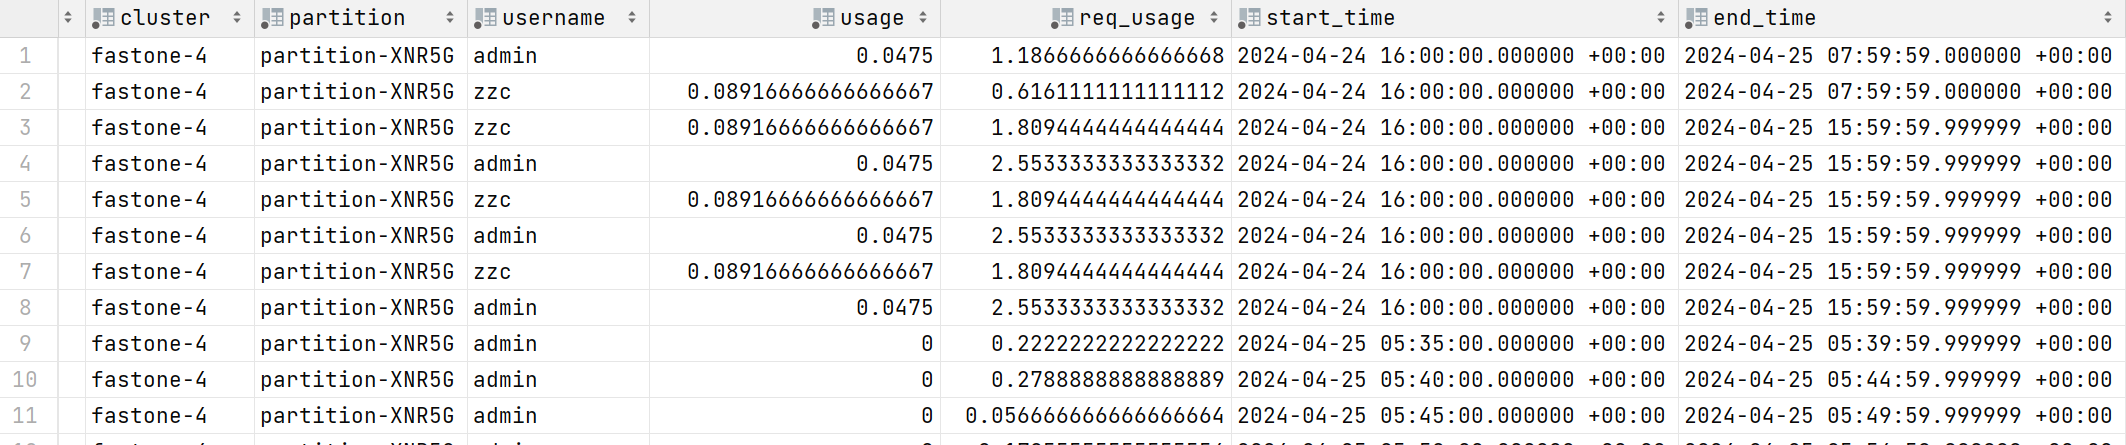
user_usages     user usage table
    cluster       cluster
    partition     partition
    username      username
    usage         usage
    req_usage     requested usage
    start_time    start time
    end_time      end time
Implementation Details
Periodically Generate Time Slices
urd periodically generates time-slice records in the time_records table to record the time range and status to be aggregated.
start_time indicates the slice start time, end_time indicates the slice end time, and state indicates the slice status.
PENDING means aggregation has not started, and COMPLETED means aggregation is finished.

In the current production environment, the generated time-slice interval is one day.
In the test environment, setting the environment variable TIME_SPLIT_BY_FIVE_MINUTES to true changes the interval to 5 minutes.
Periodically Aggregate User Usage Based on Time Slices
urd periodically queries PENDING time ranges in the time_records table that are earlier than the current day,
and calculates user usage for completed jobs within that time range.

Because job collection is delayed, aggregating usage immediately at the end of the day may miss jobs completed in the last few minutes.
Therefore, user usage is aggregated after a delay. For example, yesterday's user usage is aggregated at 2:00 AM.
In the test environment, setting the environment variable TIME_SPLIT_BY_FIVE_MINUTES to true changes the delay to 30 minutes.

The jobs table is very large. Assuming an average of 5 million records per day retained for 90 days, the total reaches 450 million records.
Querying all records at once would put too much load on the database and may cause insufficient memory, affecting normal use.
Because the jobs table is partitioned by job submission time, each query is limited to a single partition table and then executed multiple times to improve query efficiency.
Tests on a table with 5 million records show that a single query takes about 20 seconds, and querying 90 days of data takes about 30 minutes.
SELECT
			username, cluster, queue as partition,
			SUM(cur_cpu)::FLOAT as usage,
			SUM(exec_dur * req_cpu)::FLOAT as req_usage
			from jobs
			where status = ?
			-- Limit the query range to a single partition table
			and submit_at > ? and submit_at < ?
			and end_at > ? and end_at < ?
			group by username, cluster, partition
jobs
- Stored in
Table Partitionformat- A partition is created per day
- By default, data is retained for 90 days, and data older than 90 days is detached from the parent table
- A detached table becomes an independent discrete table, for example
jobs_20231231
- Fields
job_id: job IDjob_name: job namecluster: cluster name, for examplefastone-1uid: UID of the user who submitted the jobusername: username of the user who submitted the jobgroup_id: group ID of the user who submitted the jobpriority: job priorityaccount: job accountqos: QOS useddependency: job dependencyqueue: job queue or partitionstatus: job statuscommand: submitted command, including command and parameterssubmit_host: submission hostexec_host: execution host, comma-separated when multiple hosts are usedcwd: current working directorysubmit_at: job submission timestart_at: job start timeend_at: job end timewait_dur: job wait duration in secondsexec_dur: job execution duration in secondsexit_code: exit codeexit_sig: exit signalreason: reason forpending,suspended, orexitwckey: wckeyreq_mem: requested memory in bytesreq_node: requested number of nodesreq_cpu: requested number of CPUsrun_time: elapsed runtime in secondstime_limit: maximum runtime in secondseligible_time: eligible timeaccrue_time: time when priority accumulation startsdeadline: configured deadlinereq_nodes: requested node listexc_nodes: excluded node listmax_cpus: maximum available CPUs for the jobmax_nodes: maximum available nodes for the jobnum_tasks: requested task counttres_req_str: requested resources, such ascpu=1,mem=1G,node=1tres_alloc_str: allocated resources, such ascpu=1,mem=1G,node=1pn_min_cpus: minimum CPU count per nodepn_min_momory: minimum memory per node in bytesliceses: requested licensesstd_err: stderr file pathstd_in: stdin file pathstd_out: stdout file pathalloc_cpu: allocated CPU countcur_node: current number of nodes used by the jobpeak_mem_per_task: peak memory per task during execution in bytesavg_mem: average memory during execution in bytescur_cpu: CPU time used by the job in seconds
Data Sources for UI-Grafana
Cluster Monitoring
Cluster Overview
Number of Jobs by Cluster Job Status
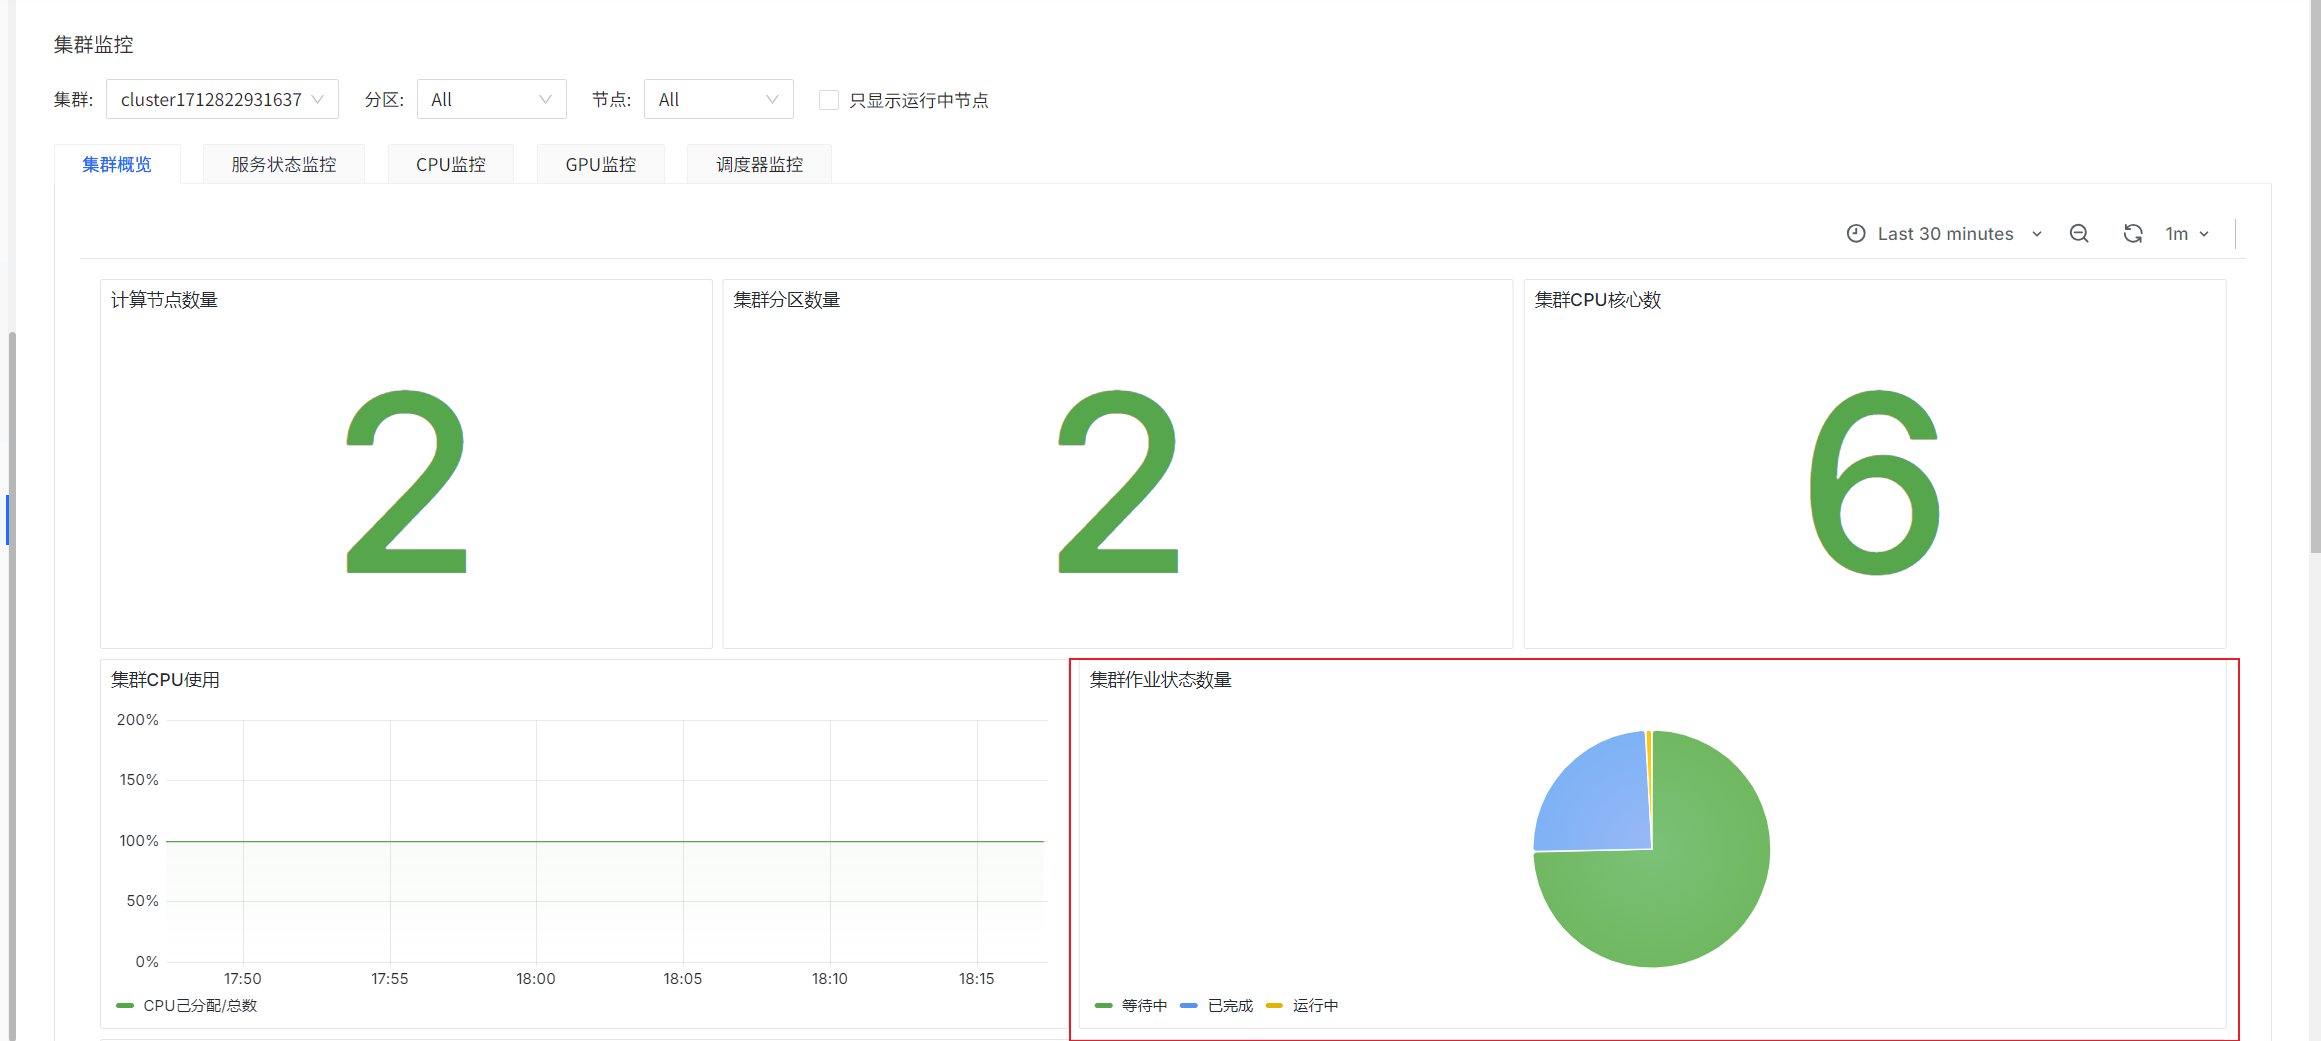
sum(slurm_partition_jobs_pending{clusterId='$clusterId'})
sum(slurm_partition_jobs_running{clusterId='$clusterId'})
sum(slurm_partition_jobs_completed{clusterId='$clusterId'})
prometheus-slurm-exporter periodically queries cluster job states and counts them. These are instantaneous values.
Partition List: Average Wait Time of Pending Jobs
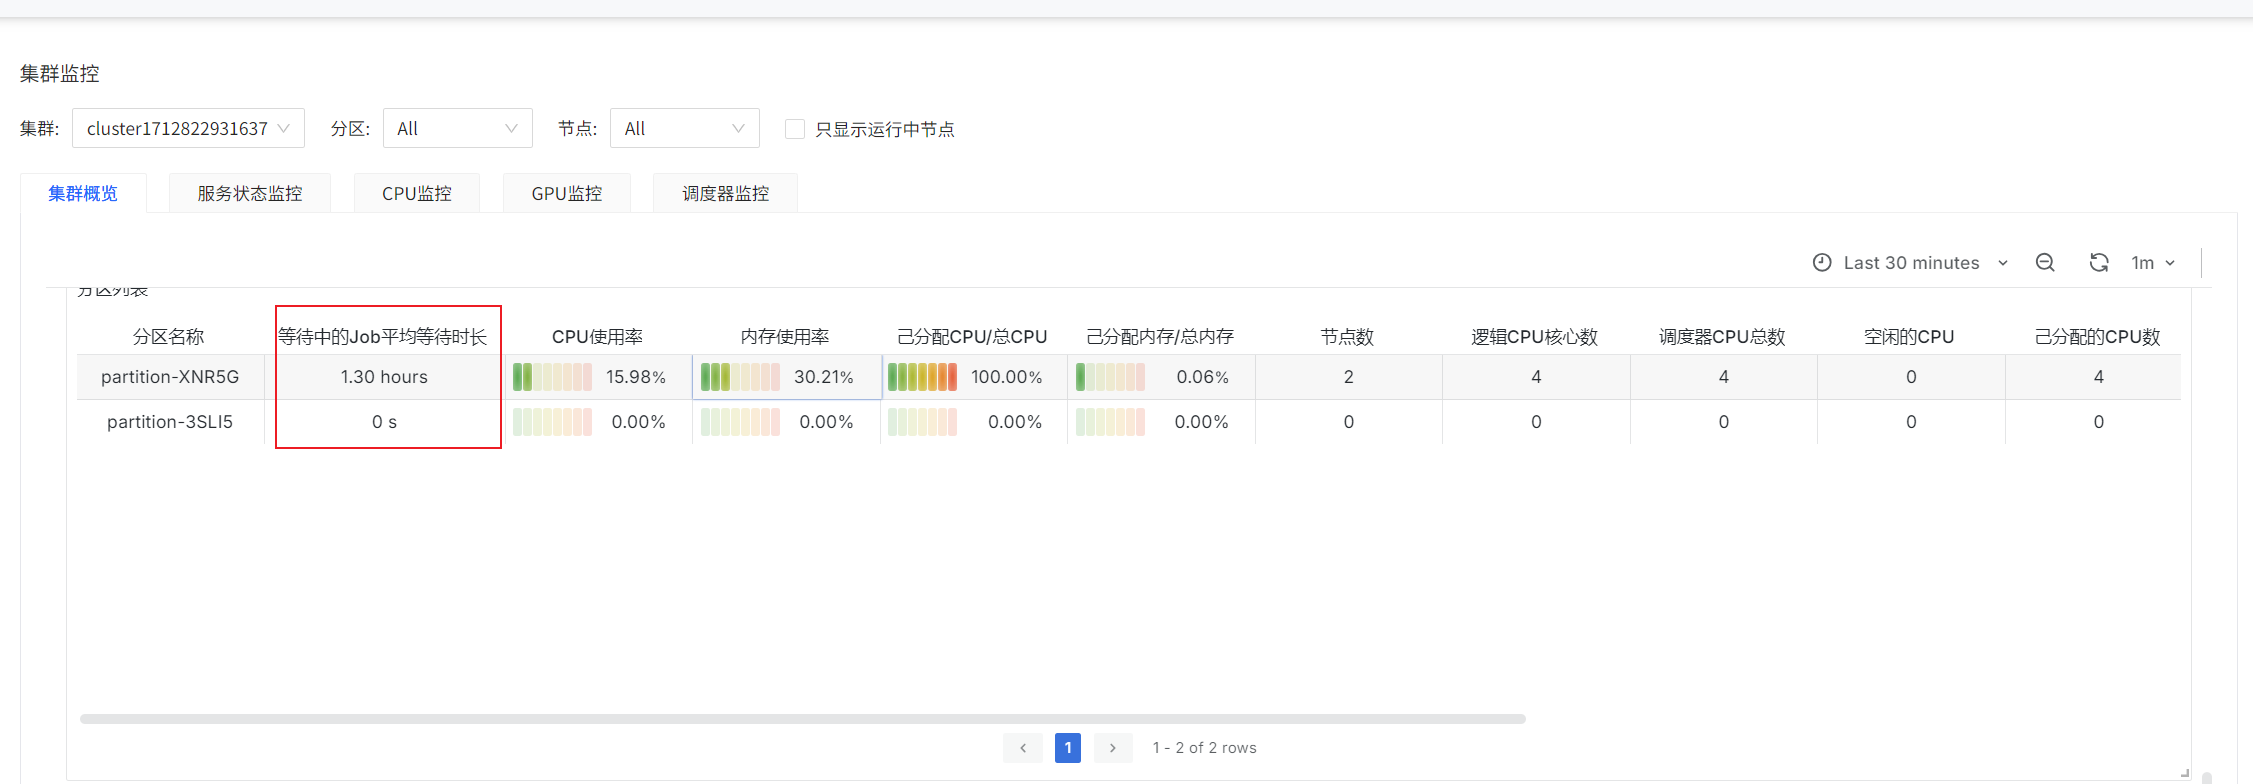
label_replace(avg by(partition)(slurm_partition_jobs_pending_wait_time{clusterId=~"$clusterId",partition=~"$partitionName",nodeId=~"$nodeId"}),"partitionName","$1","partition","(.*)")
prometheus-slurm-exporter periodically queries pending jobs in the cluster and counts their wait time. These are instantaneous values.
Number of Pending Jobs per Partition and Number of Running Jobs per Partition
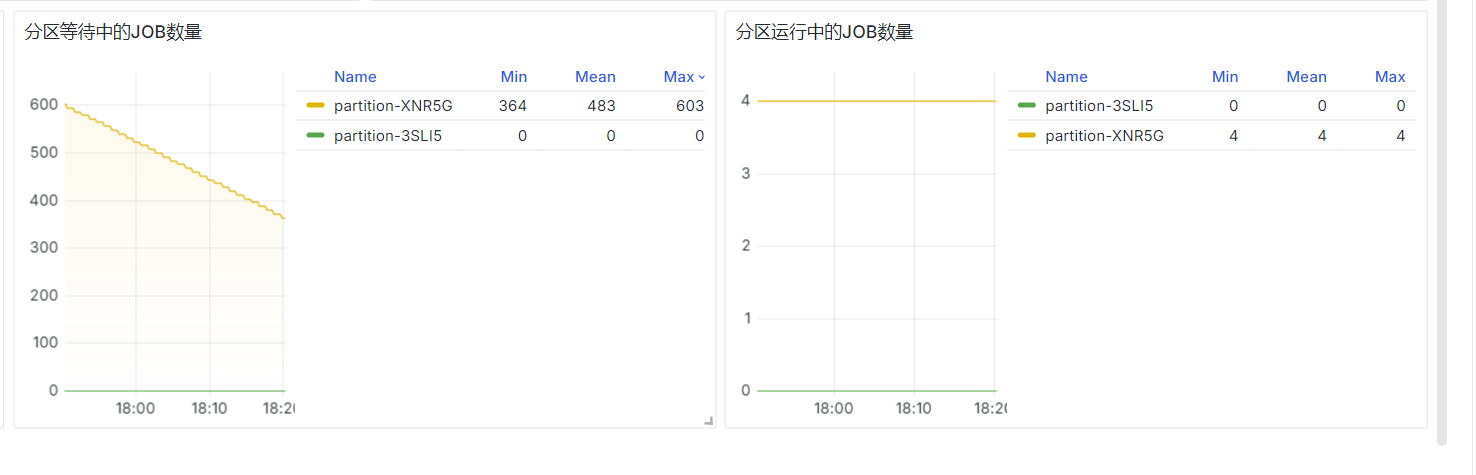
sum by (partition)(slurm_partition_jobs_pending{clusterId="$clusterId"})
sum by (partition)(slurm_partition_jobs_running{clusterId="$clusterId"})
prometheus-slurm-exporter periodically queries cluster job states and counts them. These are instantaneous values.
Cluster Analytics
Execution Time of Completed Jobs in the Last 10 Minutes

SELECT
queue as "Partition",
DATE_TRUNC('second', AVG(end_at - start_at)) as "Average Execution Time (HH:mm:ss)",
DATE_TRUNC('second', AVG(start_at - submit_at)) as "Average Wait Time (HH:mm:ss)"
from
jobs
where submit_at > (CURRENT_TIMESTAMP - INTERVAL '30 days')
 and status = 'COMPLETED'
 and cluster = 'fastone-$ClusterId'
 and end_at > (CURRENT_TIMESTAMP - INTERVAL '600 seconds')
GROUP BY queue
;
Pending and Running Jobs
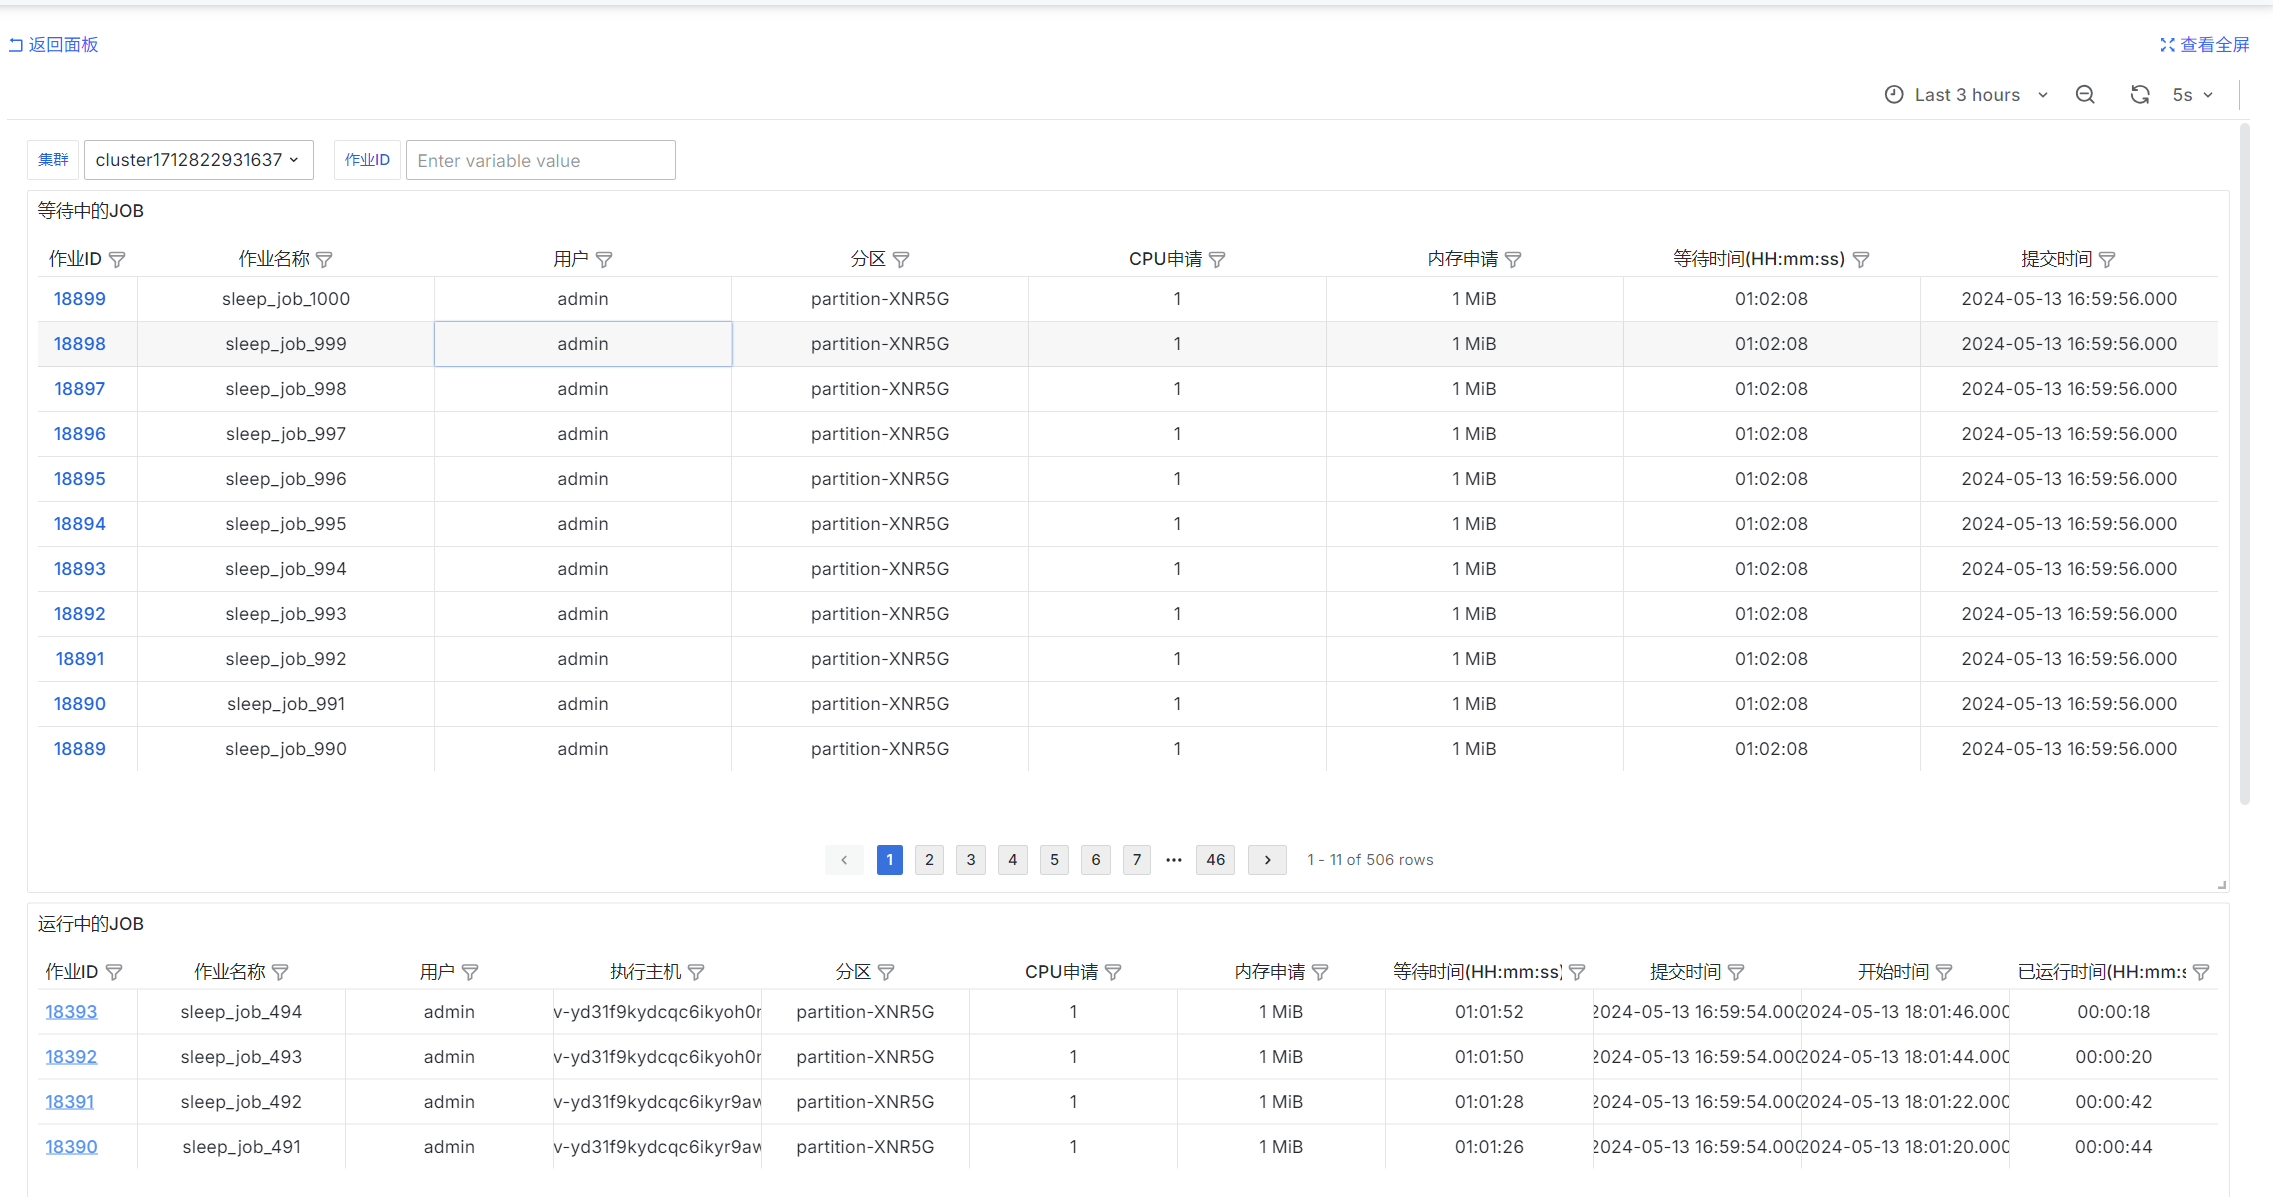
Pending jobs
select
job_id as "Job ID",
job_name as "Job Name",
username as "User",
queue as "Partition",
req_cpu as "Requested CPU",
req_mem as "Requested Memory",
DATE_TRUNC('second', CURRENT_TIMESTAMP - submit_at) as "Wait Time (HH:mm:ss)",
submit_at as "Submission Time"
FROM
jobs
where
$__timeFilter(submit_at)
and status = 'PENDING'
and cluster = 'fastone-$ClusterId'
and ('$JobId' = '' or job_id = '$JobId')
and ('$IsAdmin' = 'true' or ('$Username' = '' or username = '$Username'))
order by job_id::int desc
limit 20000
Running jobs
select
job_id as "Job ID",
job_name as "Job Name",
username as "User",
exec_host as "Execution Host",
queue as "Partition",
req_cpu as "Requested CPU",
req_mem as "Requested Memory",
start_at - submit_at as "Wait Time (HH:mm:ss)",
submit_at as "Submission Time",
start_at as "Start Time",
DATE_TRUNC('second', CURRENT_TIMESTAMP - start_at) as "Elapsed Runtime (HH:mm:ss)"
FROM
jobs
where
$__timeFilter(submit_at)
and status = 'RUNNING'
and cluster = 'fastone-$ClusterId'
and ('$JobId' = '' or job_id = '$JobId')
and ('$IsAdmin' = 'true' or ('$Username' = '' or username = '$Username'))
order by job_id::int desc
limit 20000
Completed Jobs
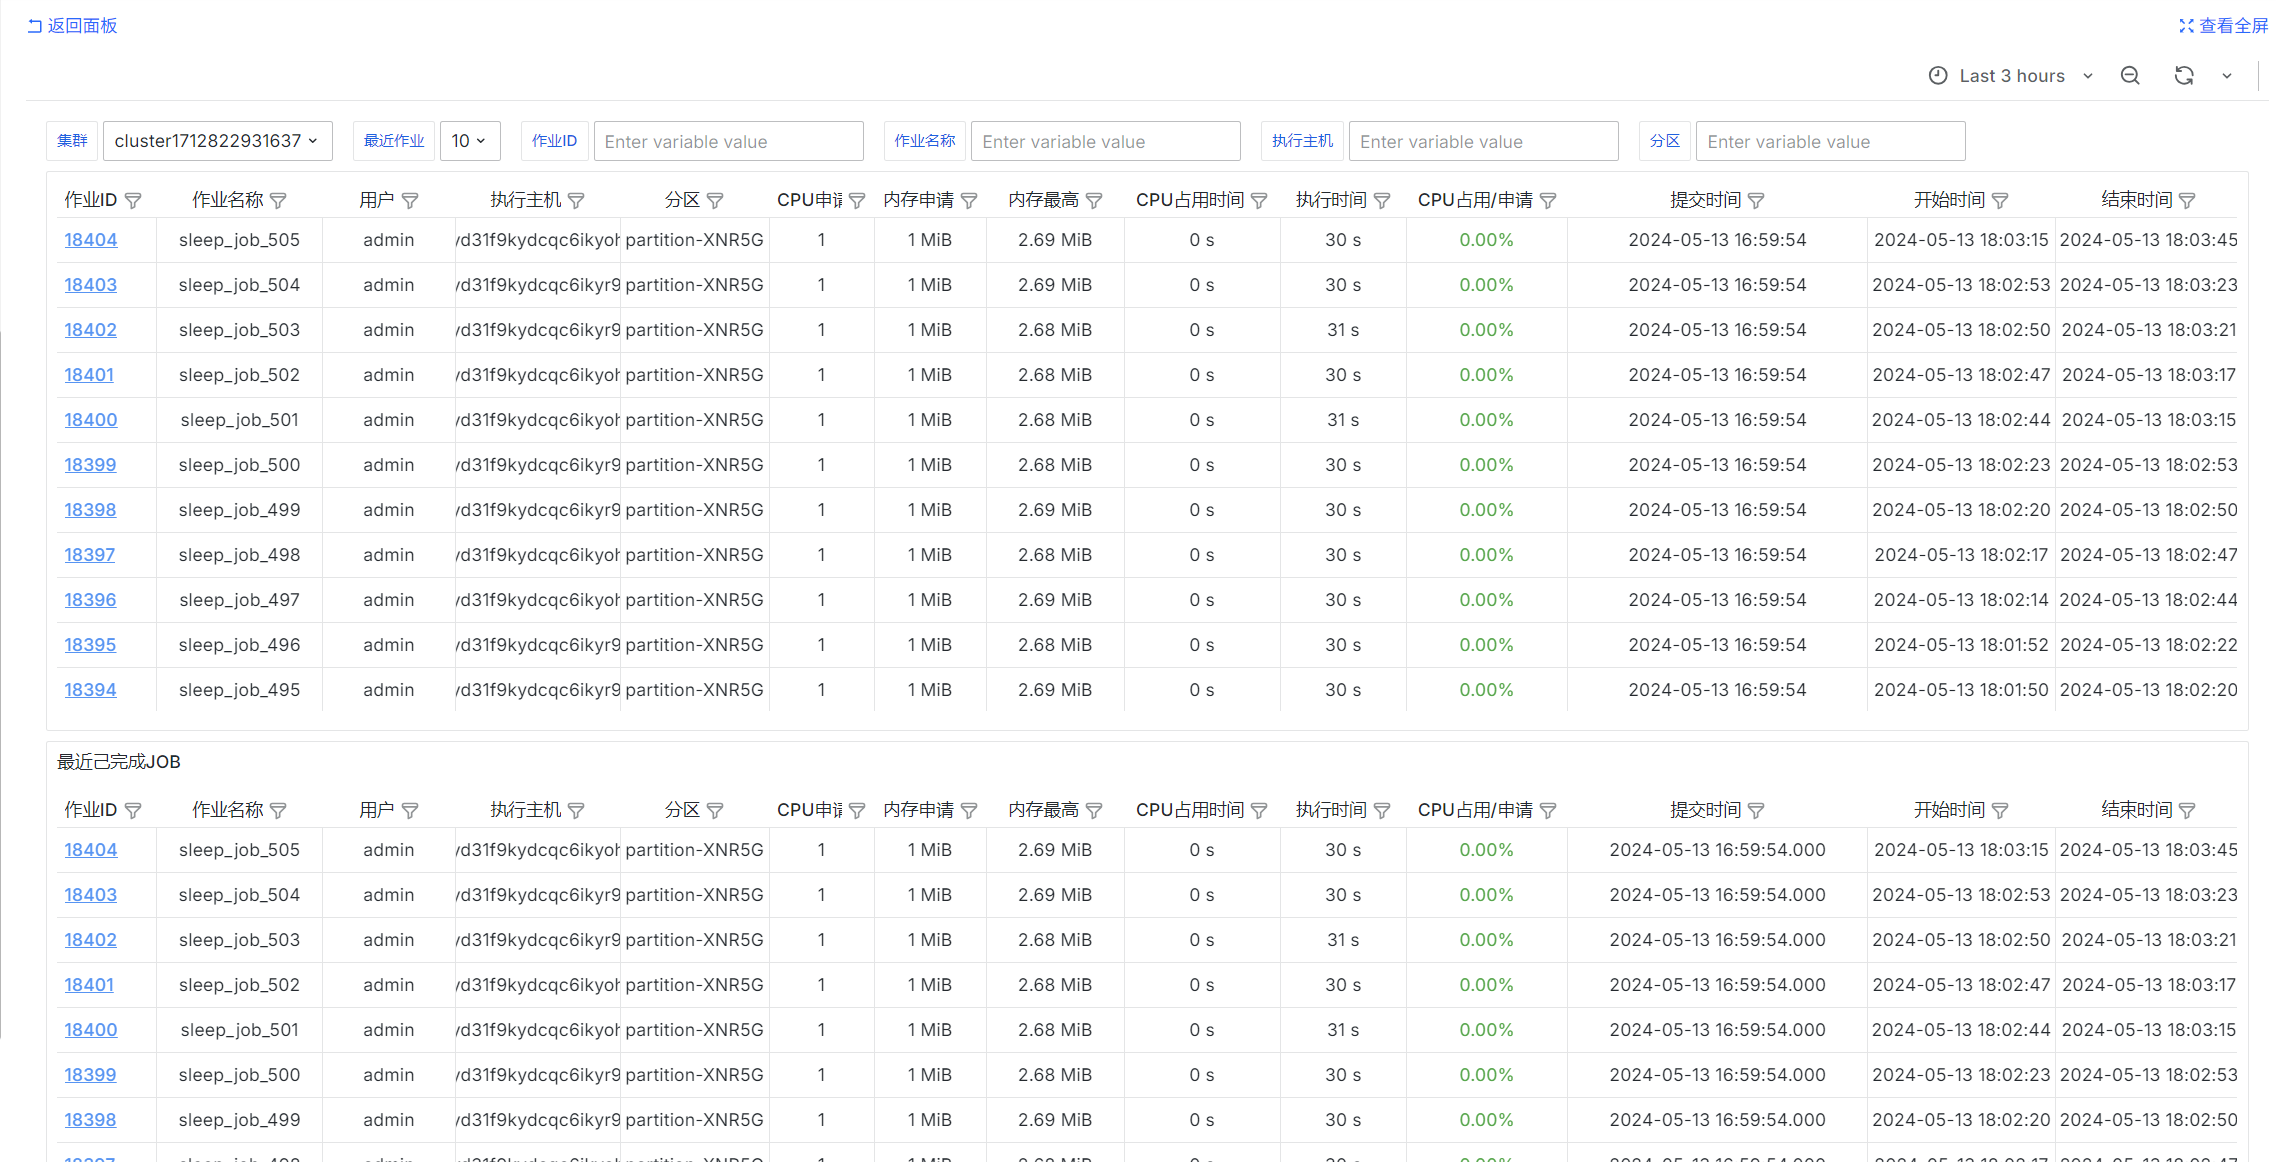
select
  job_id as "Job ID",
  job_name as "Job Name",
  username as "User",
  exec_host as "Execution Host",
  queue as "Partition",
  req_cpu as "Requested CPU",
  req_mem as "Requested Memory",
  peak_mem_per_task as "Peak Memory",
  cur_cpu as "CPU Time Used",
  exec_dur as "Execution Duration",
  cur_cpu::float / NULLIF(exec_dur * req_cpu, 0) as "CPU Used / Requested",
  submit_at as "Submission Time",
  start_at as "Start Time",
  end_at as "End Time",
  status as "Status"
from jobs
where
$__timeFilter(submit_at)
and cluster = 'fastone-$ClusterId'
and status not in ('PENDING', 'RUNNING', 'SUSPENDED')
AND ('$JobId' = '' OR job_id = '$JobId')
and ('$JobName' = '' or job_name = '$JobName')
and ('$IsAdmin' = 'true' or ('$Username' = '' or username = '$Username'))
and ('$Partition' = '' or queue = '$Partition')
and ('$ExecHost' = '' or exec_host = '$ExecHost')
order by job_id::int desc
limit 10000;
select
  job_id as "Job ID",
  job_name as "Job Name",
  username as "User",
  exec_host as "Execution Host",
  queue as "Partition",
  req_cpu as "Requested CPU",
  req_mem as "Requested Memory",
  peak_mem_per_task as "Peak Memory",
  cur_cpu as "CPU Time Used",
  exec_dur as "Execution Duration",
  cur_cpu::float / NULLIF(exec_dur * req_cpu, 0) as "CPU Used / Requested",
  submit_at as "Submission Time",
  start_at as "Start Time",
  end_at as "End Time",
  status as "Status"
from jobs
where
$__timeFilter(submit_at)
and cluster = 'fastone-$ClusterId'
and status not in ('PENDING', 'RUNNING', 'SUSPENDED')
AND ('$JobId' = '' OR job_id = '$JobId')
and ('$JobName' = '' or job_name = '$JobName')
and ('$IsAdmin' = 'true' or ('$Username' = '' or username = '$Username'))
and ('$Partition' = '' or queue = '$Partition')
and ('$ExecHost' = '' or exec_host = '$ExecHost')
order by job_id::int desc
limit $LimitNum;
User Job Status Query
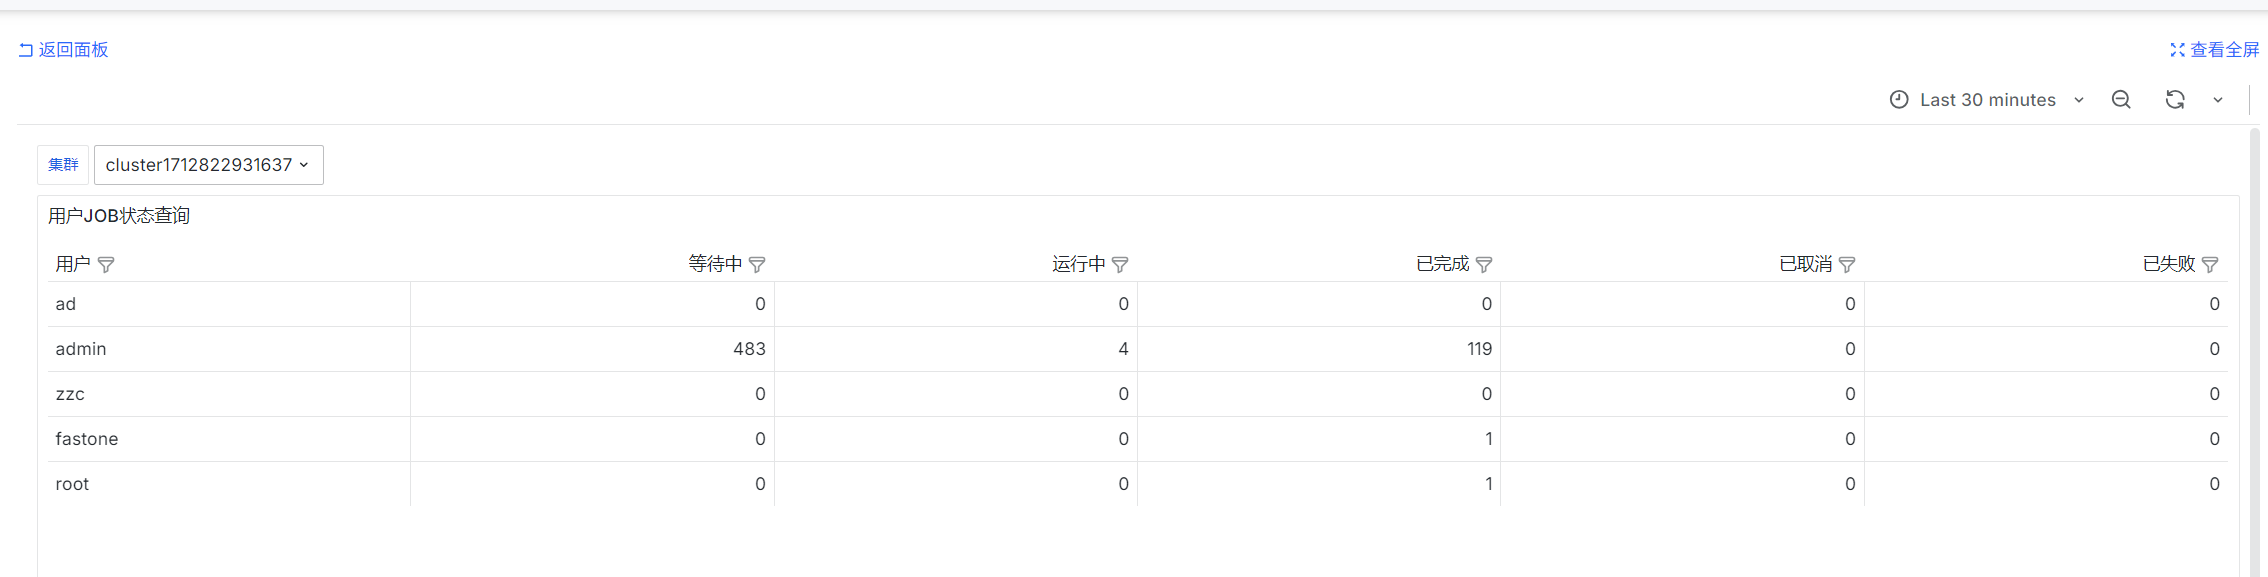
sum by (username) (urd_job_state{cluster='$ClusterId', state='PENDING'})
sum by (username) (urd_job_state{cluster='$ClusterId', state='RUNNING'})
sum by (username) (urd_job_state{cluster='$ClusterId', state='COMPLETED'})
sum by (username) (urd_job_state{cluster='$ClusterId', state='CANCELLED'})
sum by (username) (urd_job_state{cluster='$ClusterId', state='FAILED'})
urd periodically queries jobs in each cluster and counts their states. These are instantaneous values.
Job List
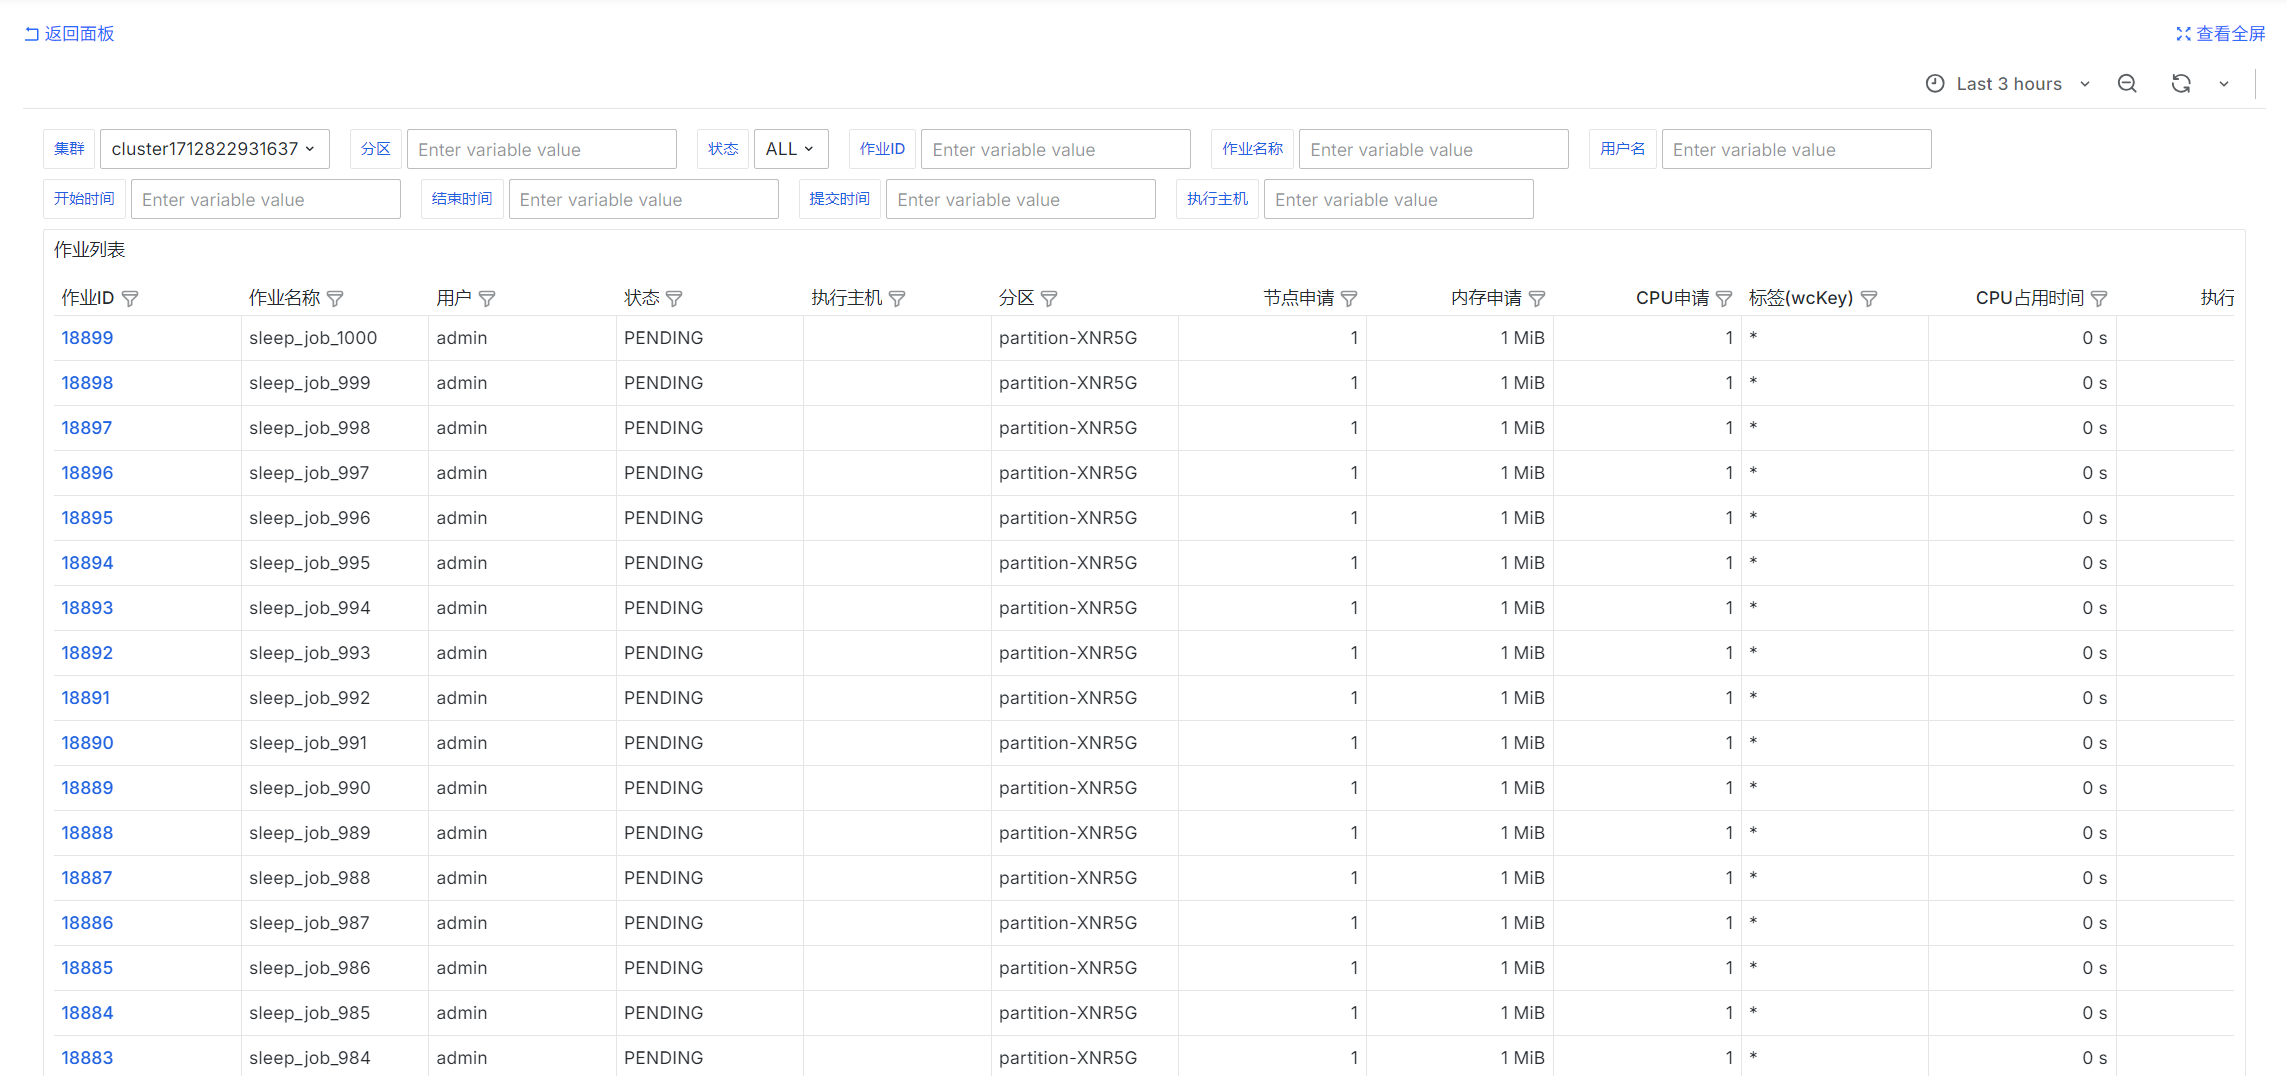
select
  job_id as "Job ID",
  job_name as "Job Name",
  username as "User",
  status as "Status",
  exec_host as "Execution Host",
  queue as "Partition",
  req_node as "Requested Nodes",
  req_mem as "Requested Memory",
  req_cpu as "Requested CPU",
  wckey as "Tag (wcKey)",
  cur_cpu as "CPU Time Used",
  exec_dur as "Execution Duration",
  cur_cpu::float / NULLIF(exec_dur * req_cpu, 0) as "CPU Used / Requested",
  wait_dur as "Wait Duration",
  submit_at as "Submission Time",
  start_at as "Start Time",
  end_at as "End Time",
  exit_code as "Exit Code",
  exit_sig as "Exit Signal"
from jobs
where
$__timeFilter(submit_at)
and cluster = 'fastone-$ClusterId'
AND ('$JobId' = '' OR job_id = '$JobId')
and ('$JobName' = '' or job_name = '$JobName')
and (('$IsAdmin' = 'true' or ('$Username' = '' or username = '$Username')) and ('$UsernameQuery' = '' or username = '$UsernameQuery'))
and ('$Partition' = '' or queue = '$Partition')
and ('$ExecHost' = '' or exec_host = '$ExecHost')
and ('$StateEn' = '' or status = '$StateEn')
and ('$SubmitAt' = '' OR submit_at < COALESCE(NULLIF('$SubmitAt', '')::timestamp, '1970-01-01 00:00:00'))
and ('$StartAt' = '' OR start_at < COALESCE(NULLIF('$StartAt', '')::timestamp, '1970-01-01 00:00:00'))
and ('$EndAt' = '' OR end_at < COALESCE(NULLIF('$EndAt', '')::timestamp, '1970-01-01 00:00:00'))
order by job_id::int desc
limit 10000;
Jobs with Unreasonable Memory Requests
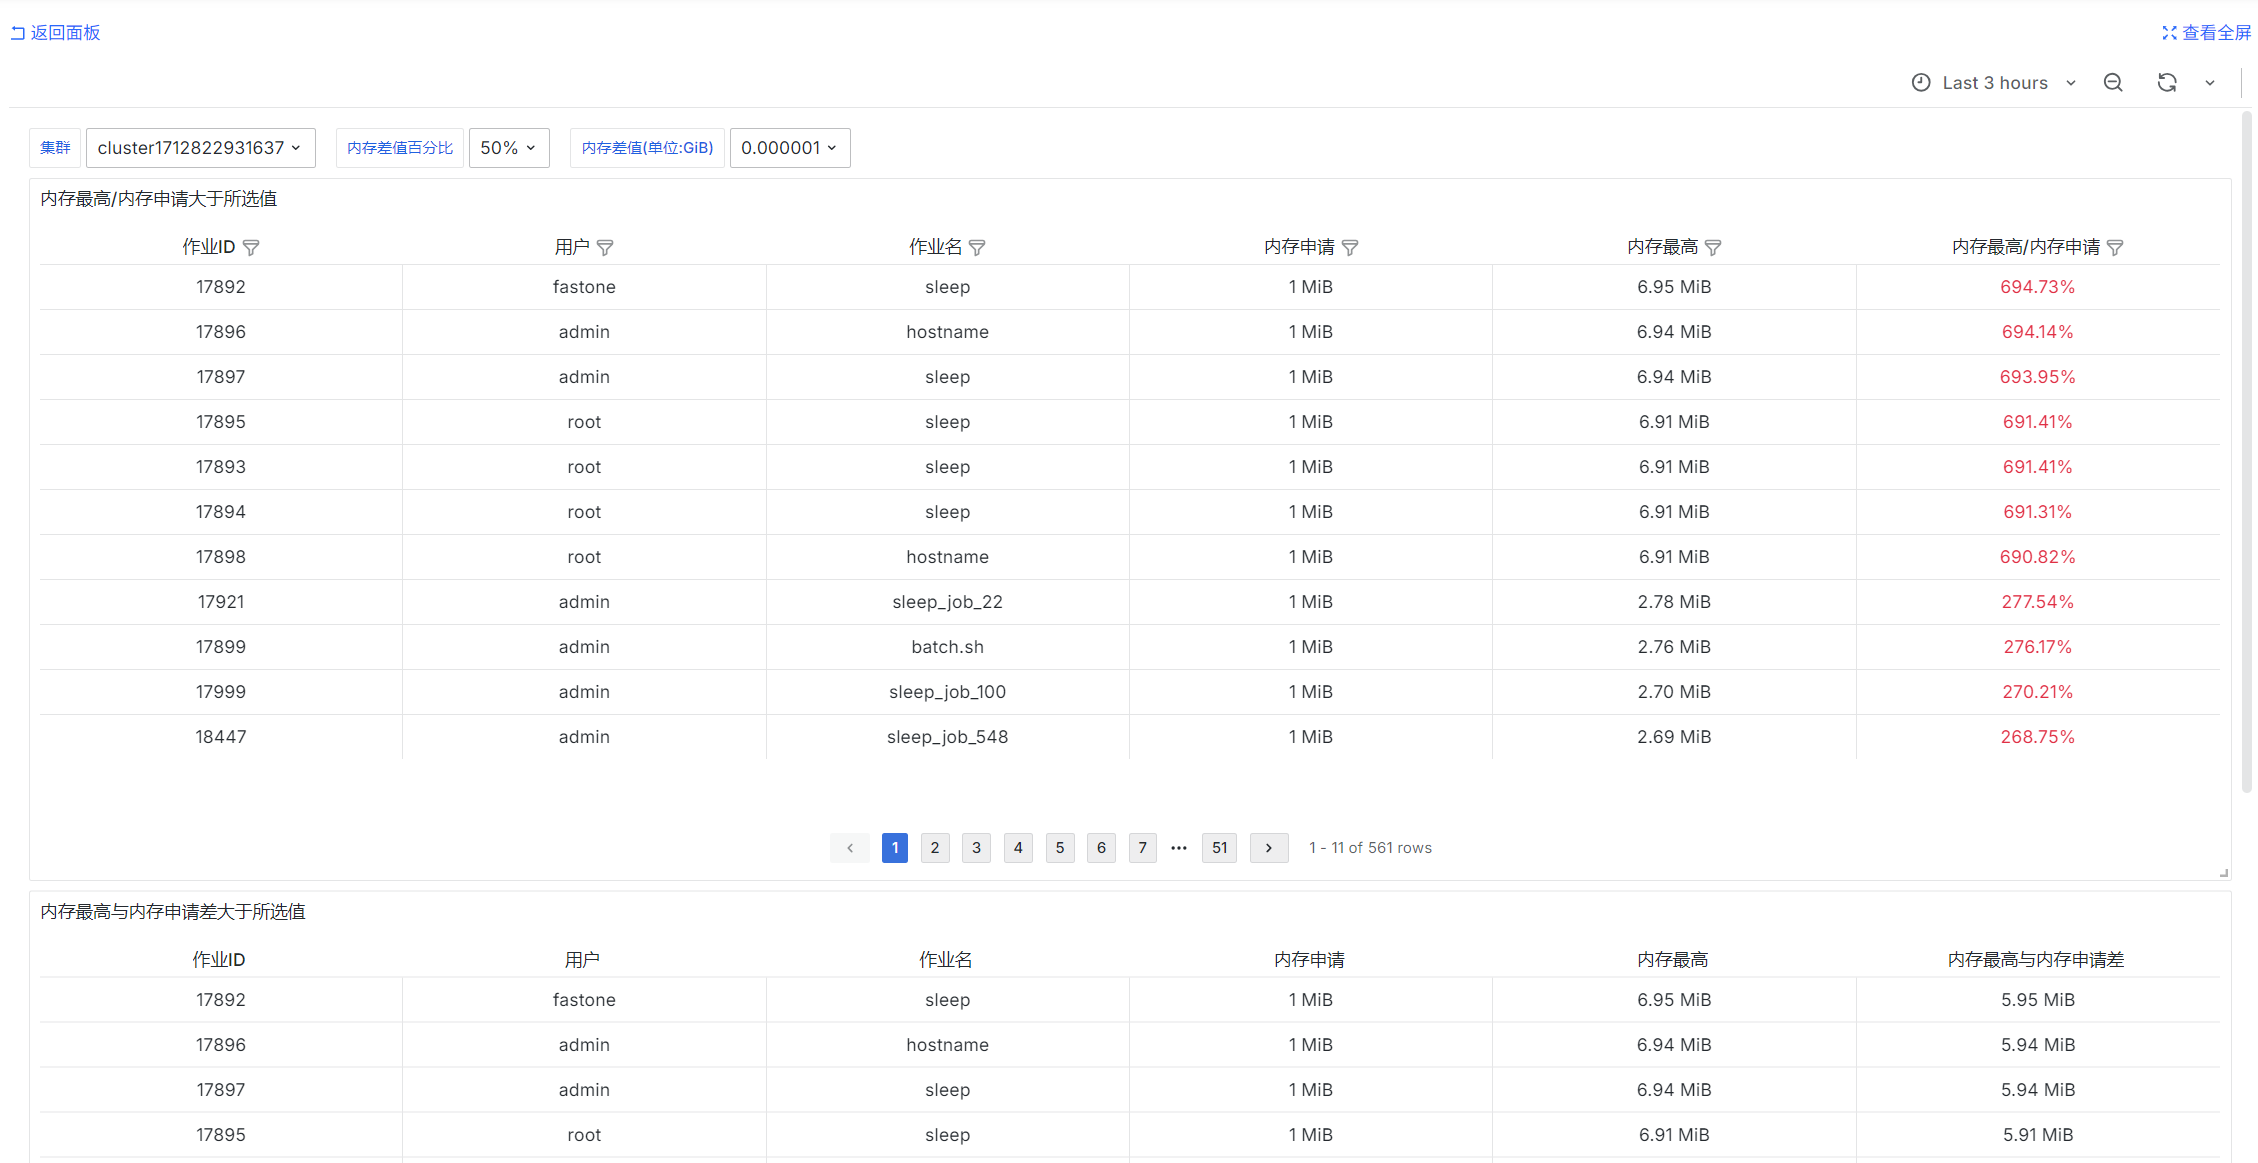
SELECT
job_id as "Job ID",
username as "User",
job_name as "Job Name",
req_mem as "Requested Memory",
peak_mem_per_task as "Peak Memory",
peak_mem_per_task::float / req_mem * 100  as "Peak Memory / Requested Memory"
FROM
jobs
where
$__timeFilter(submit_at)
and cluster = 'fastone-$ClusterId'
and status = 'COMPLETED'
and peak_mem_per_task::float / req_mem * 100 > CAST(SUBSTRING('$MemDiffPercent' FROM 1 FOR LENGTH('$MemDiffPercent') - 1) AS NUMERIC)
and ('$IsAdmin' = 'true' or ('$Username' = '' or username = '$Username'))
order by "Peak Memory / Requested Memory" desc, job_id::int desc
limit 10000
SELECT
job_id as "Job ID",
username as "User",
job_name as "Job Name",
req_mem as "Requested Memory",
peak_mem_per_task as "Peak Memory",
peak_mem_per_task - req_mem  as "Peak Memory Minus Requested Memory"
FROM
jobs
where
$__timeFilter(submit_at)
and cluster = 'fastone-$ClusterId'
and status = 'COMPLETED'
and peak_mem_per_task - req_mem >= CAST('$MemDiff' as FLOAT) * 1024 * 1024 * 1024
and ('$IsAdmin' = 'true' or ('$Username' = '' or username = '$Username'))
order by "Peak Memory Minus Requested Memory" desc, job_id::int desc
limit 10000
Jobs with Unreasonable CPU Requests
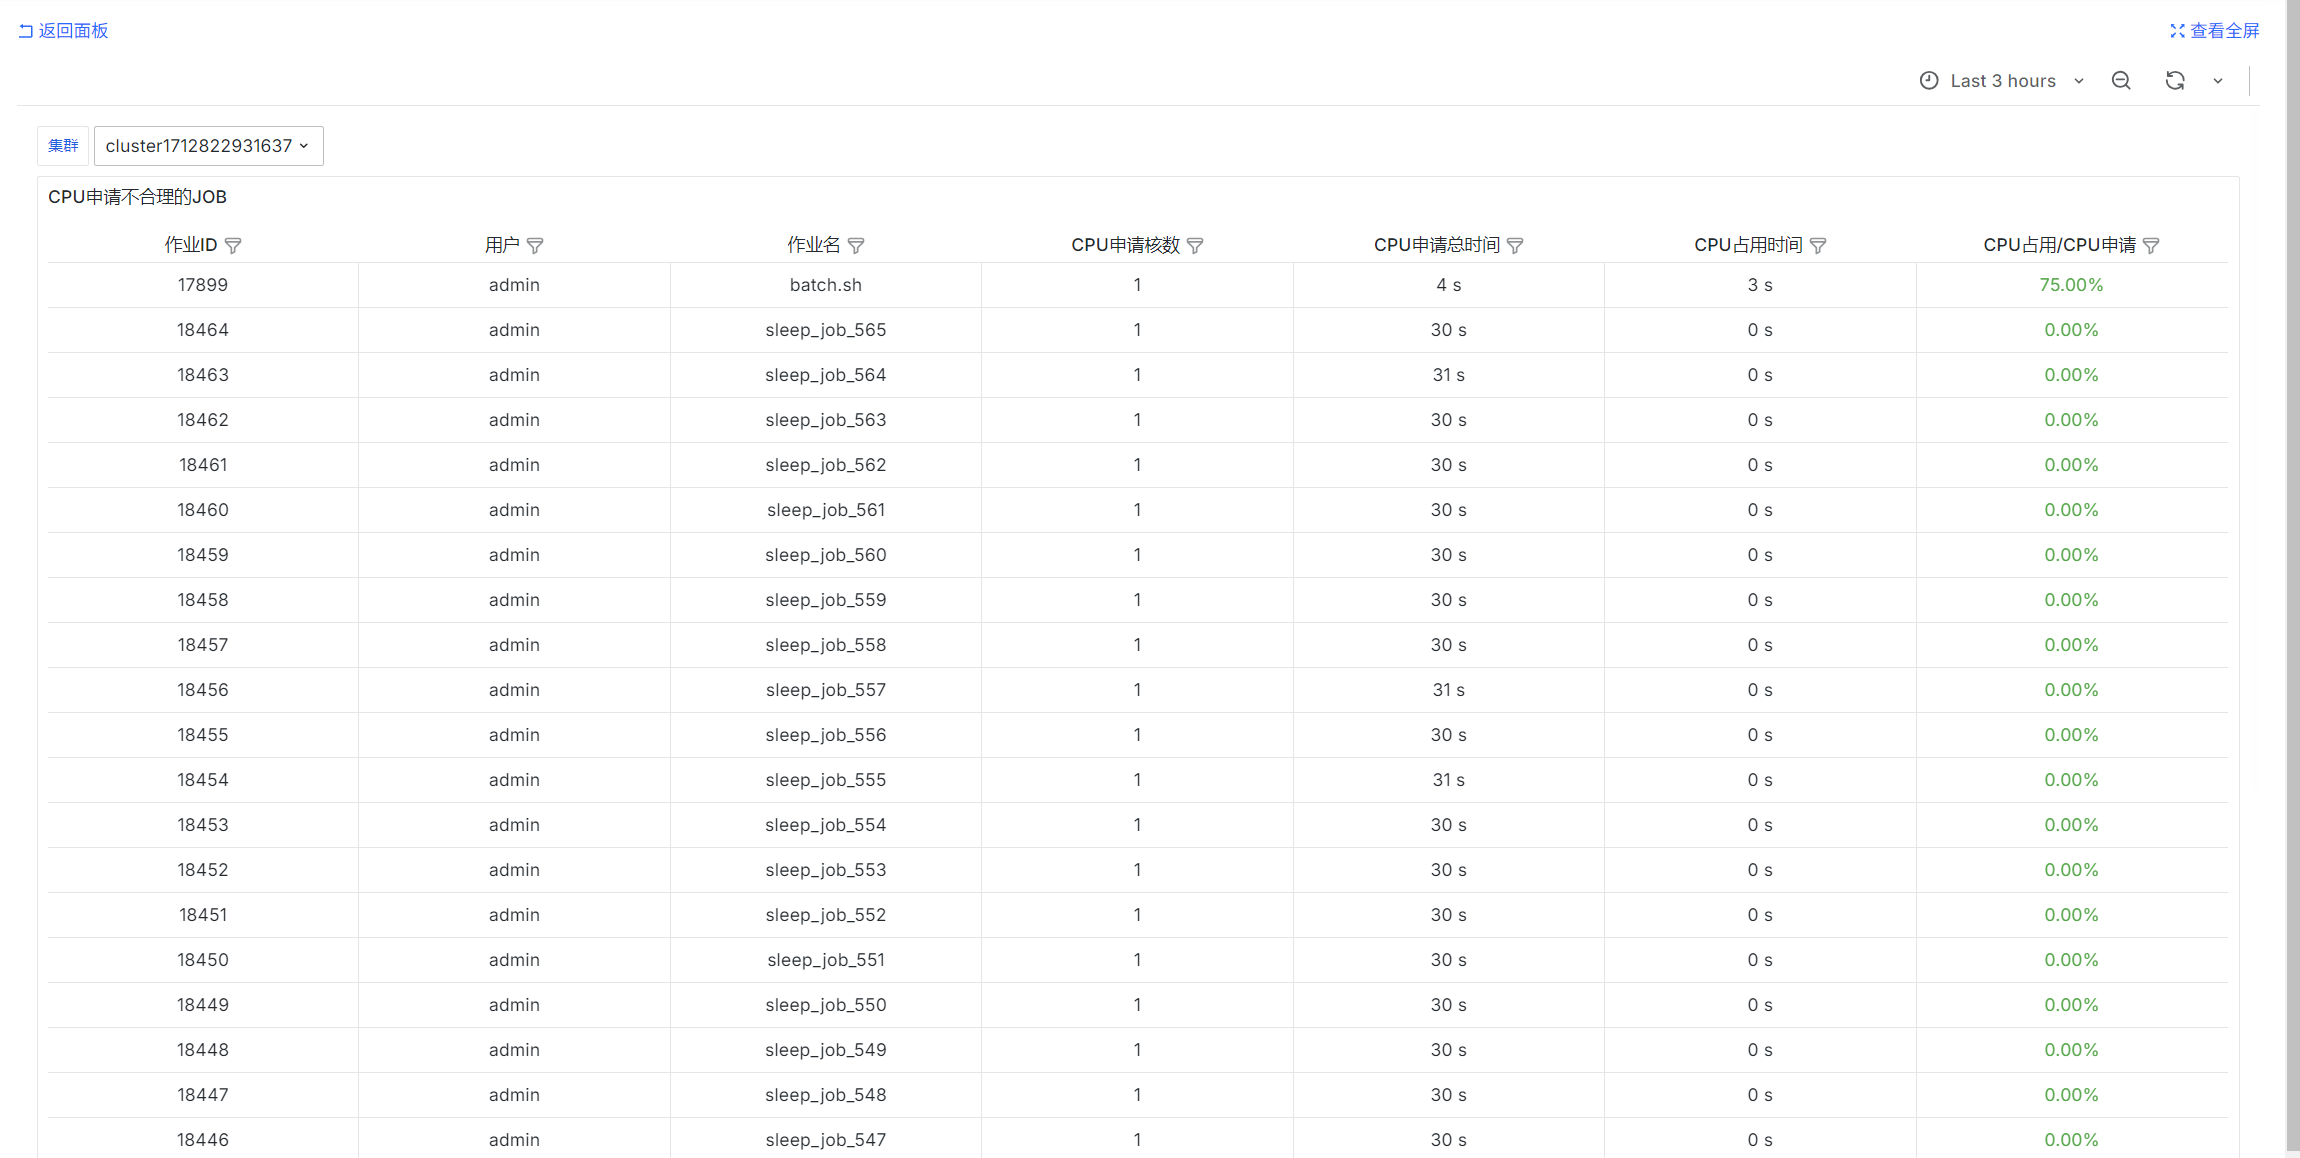
select
job_id as "Job ID",
username as "User",
job_name as "Job Name",
req_cpu as "Requested CPU Cores",
exec_dur * req_cpu as "Total Requested CPU Time",
cur_cpu as "CPU Time Used",
cur_cpu / NULLIF(exec_dur * req_cpu::float, 0) as "CPU Used / Requested"
from
jobs
where
$__timeFilter(submit_at)
and status = 'COMPLETED'
and cluster = 'fastone-$ClusterId'
and ('$IsAdmin' = 'true' or ('$Username' = '' or username = '$Username'))
order by "CPU Used / Requested" desc NULLS LAST, job_id desc
limit 10000;
User Usage Statistics
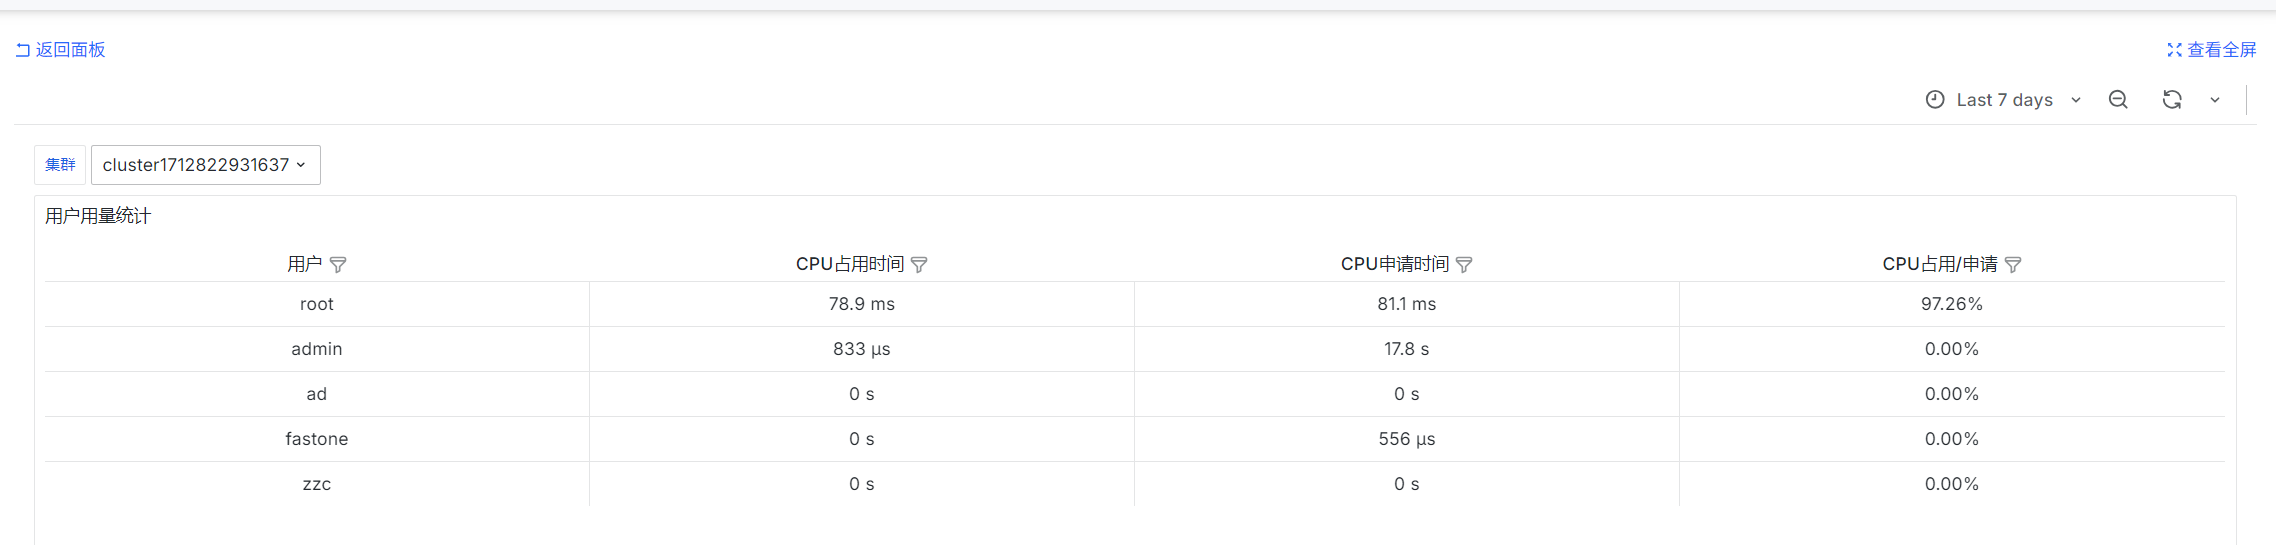
SELECT
username as "User",
sum(usage) as "CPU Time Used",
sum(req_usage) as "Requested CPU Time",
sum(usage) / NULLIF(sum(req_usage), 0) as "CPU Used / Requested"
from user_usages
where
$__timeFilter(end_time)
and cluster = 'fastone-$ClusterId'
and ('$IsAdmin' = 'true' or ('$Username' = '' or username = '$Username'))
group by username
order by "CPU Time Used" desc
Jobs That Exited Abnormally
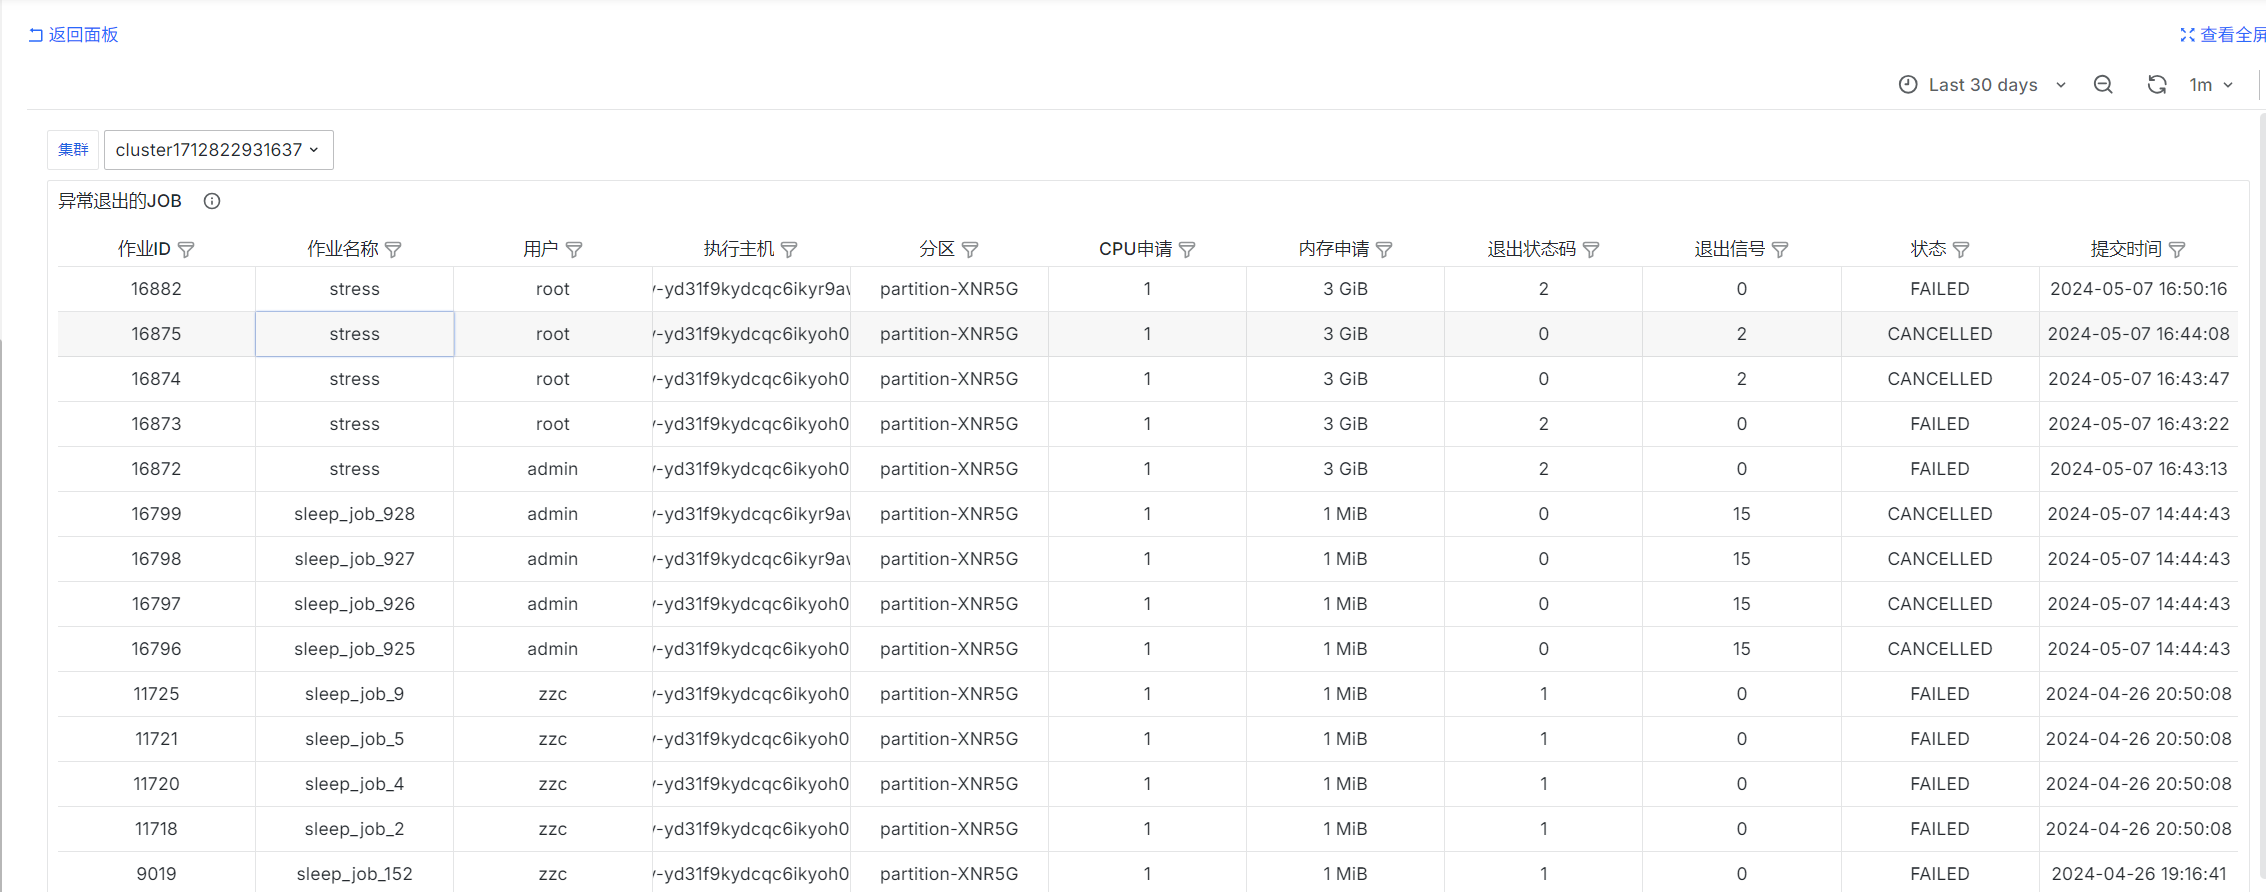
select
job_id as "Job ID",
job_name as "Job Name",
username as "User",
exec_host as "Execution Host",
queue as "Partition",
req_cpu as "Requested CPU",
req_mem as "Requested Memory",
exit_code as "Exit Status Code",
exit_sig as "Exit Signal",
status as "Status",
submit_at as "Submission Time"
from jobs
where
$__timeFilter(submit_at)
and (exit_code != 0 or exit_sig != 0)
and cluster = 'fastone-$ClusterId'
and ('$IsAdmin' = 'true' or ('$Username' = '' or username = '$Username'))
order by job_id::int desc
limit 10000;
Average Wait Time of Pending Jobs in the Cluster
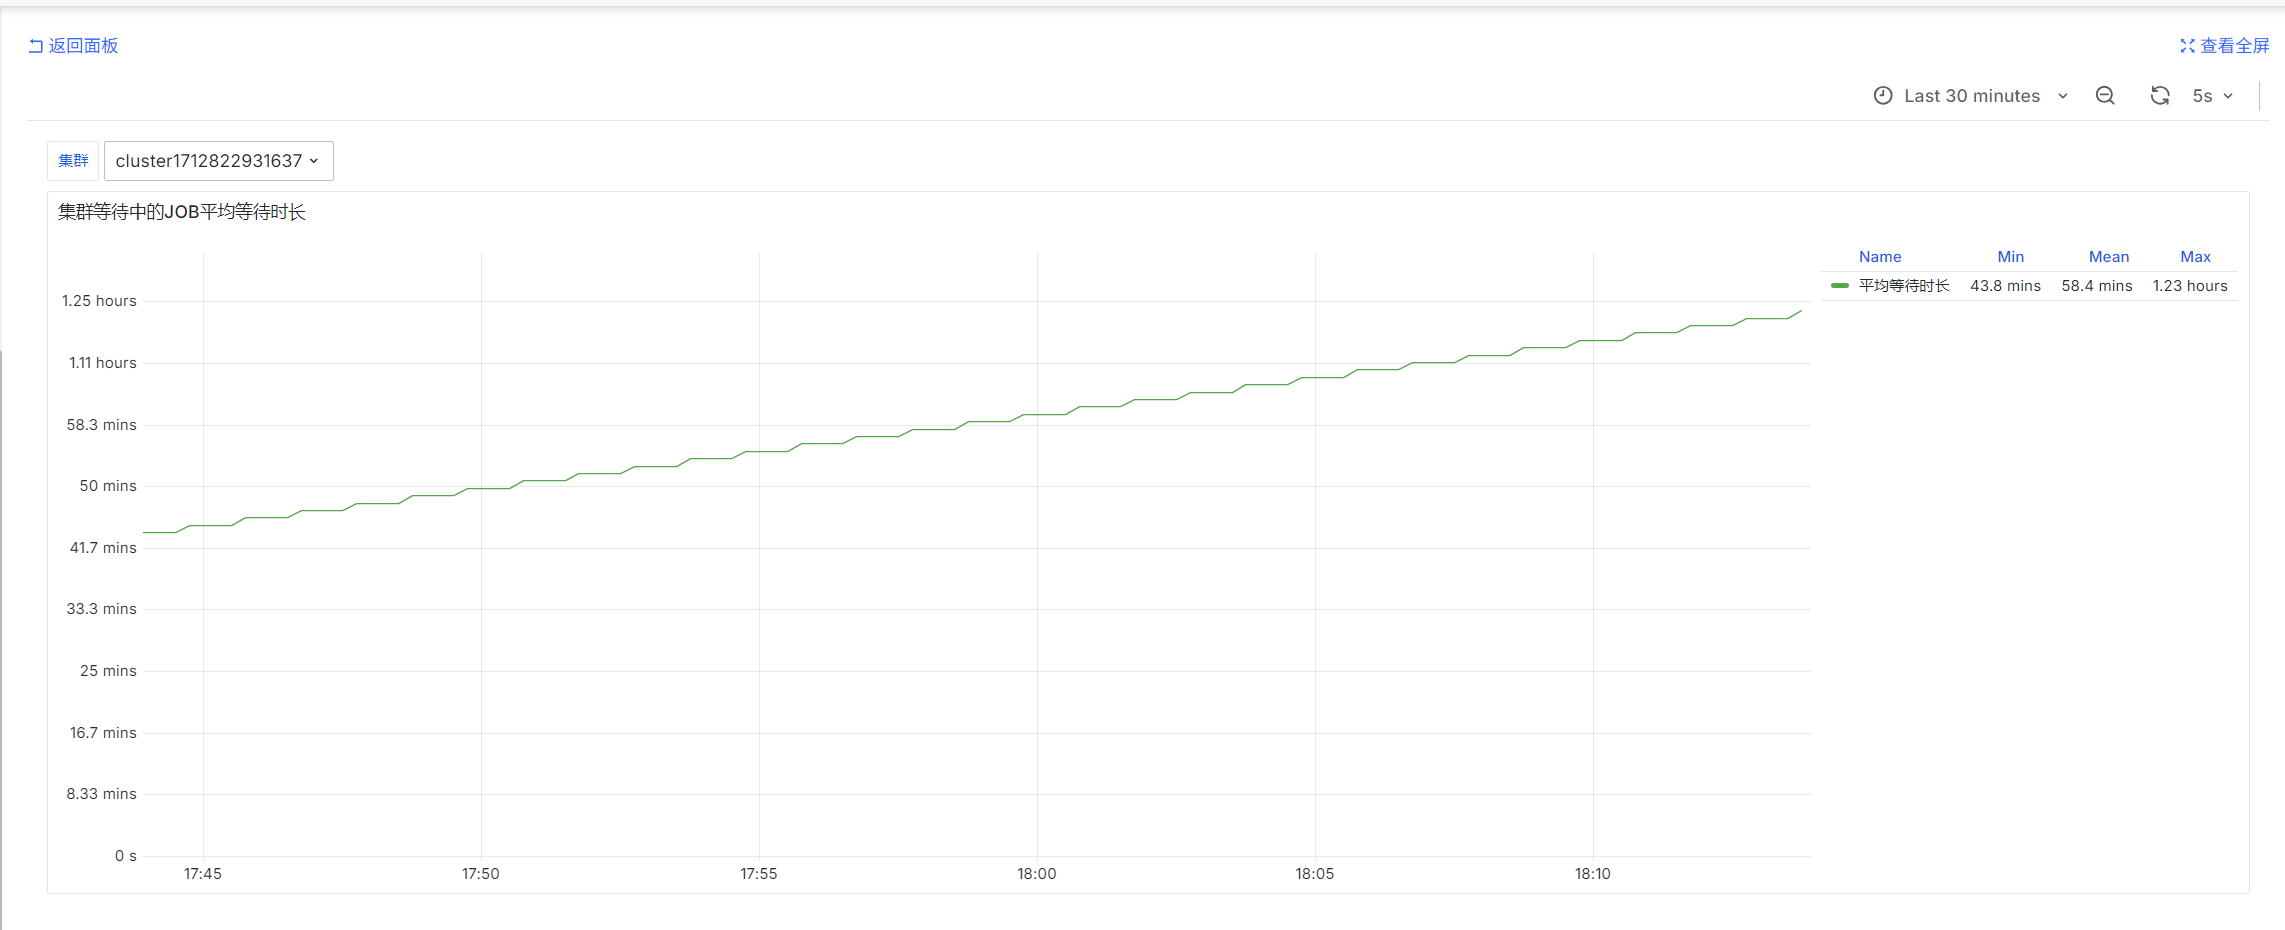
slurm_partition_jobs_pending_wait_time_total{csClusterId='$ClusterId'}
prometheus-slurm-exporter periodically queries pending jobs in the cluster and counts wait time. These are instantaneous values.
Average Wait Time of Pending Jobs by Partition
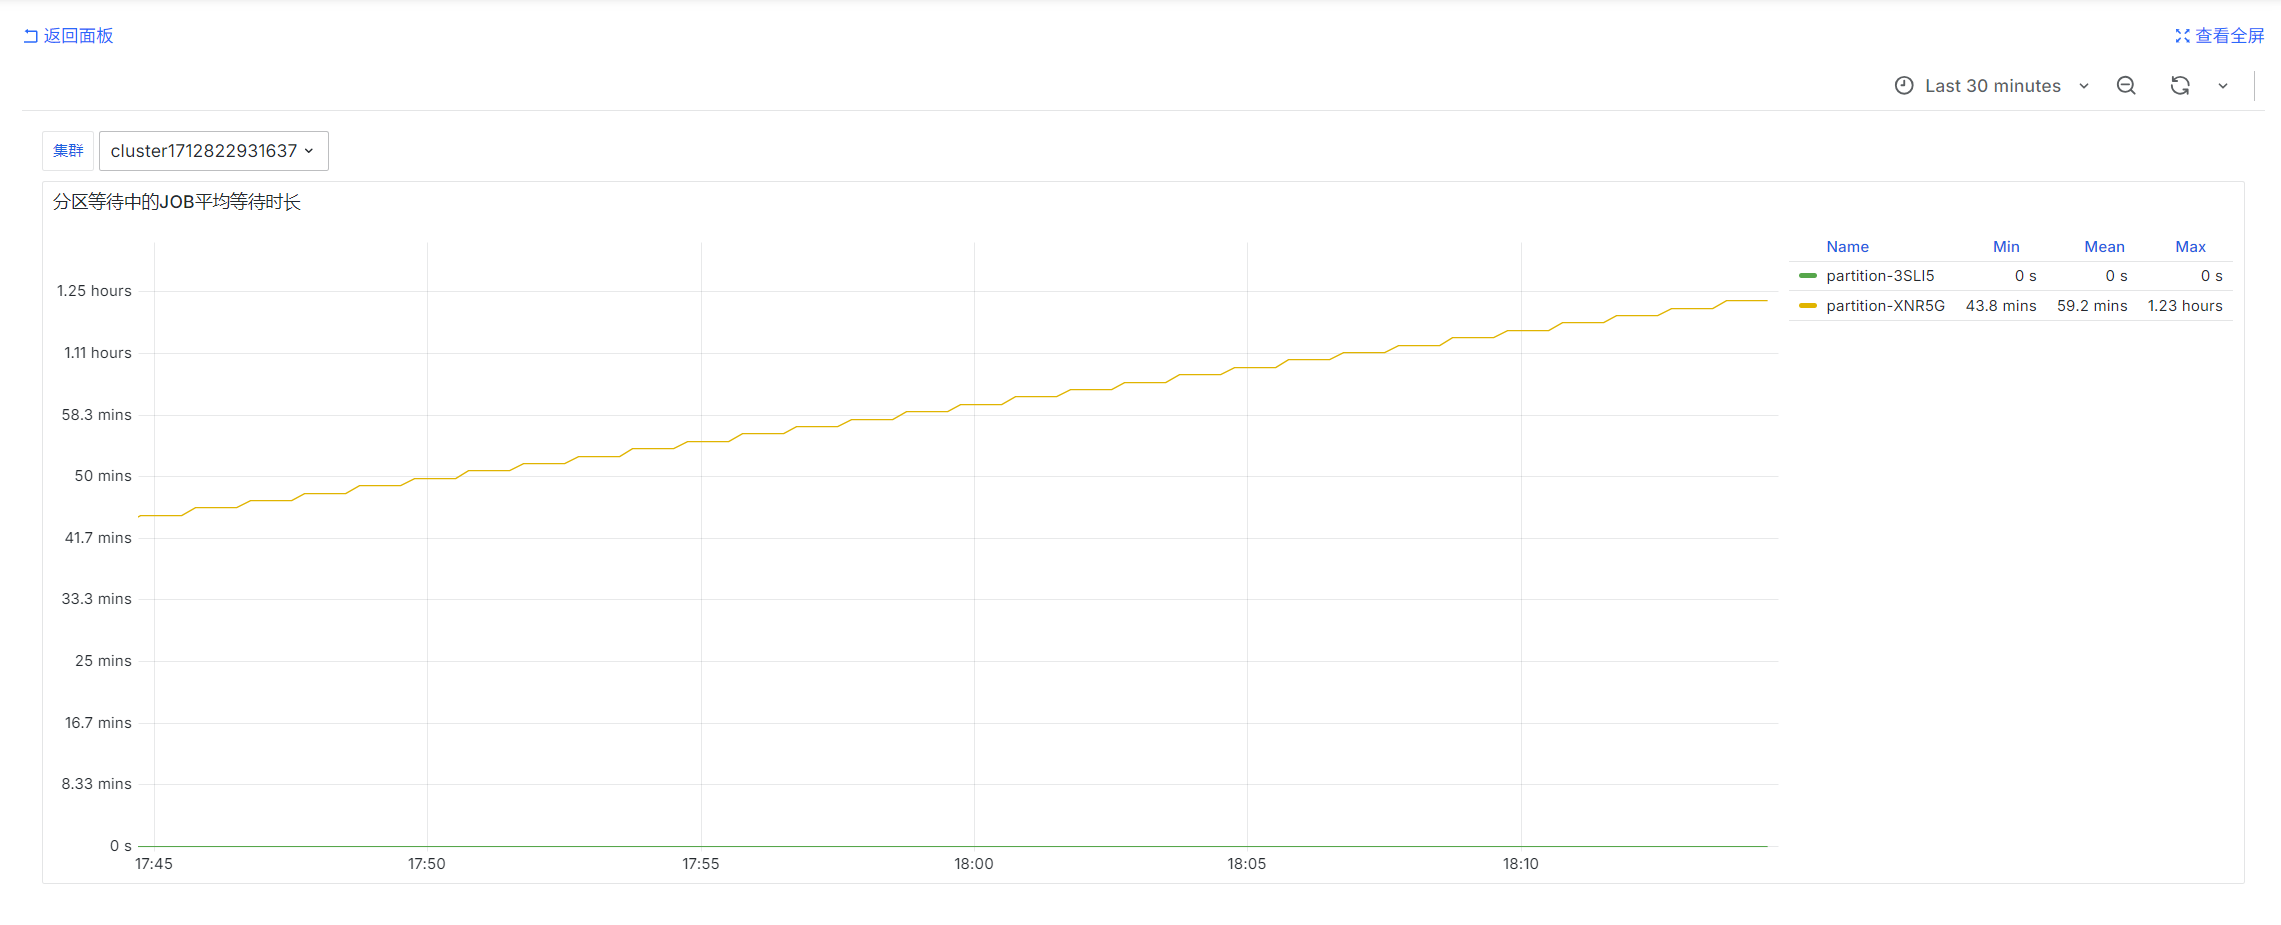
avg by (partition)(slurm_partition_jobs_pending_wait_time{csClusterId='$ClusterId'})
prometheus-slurm-exporter periodically queries pending jobs in the cluster and counts wait time. These are instantaneous values.
Number of Completed Jobs by Partition
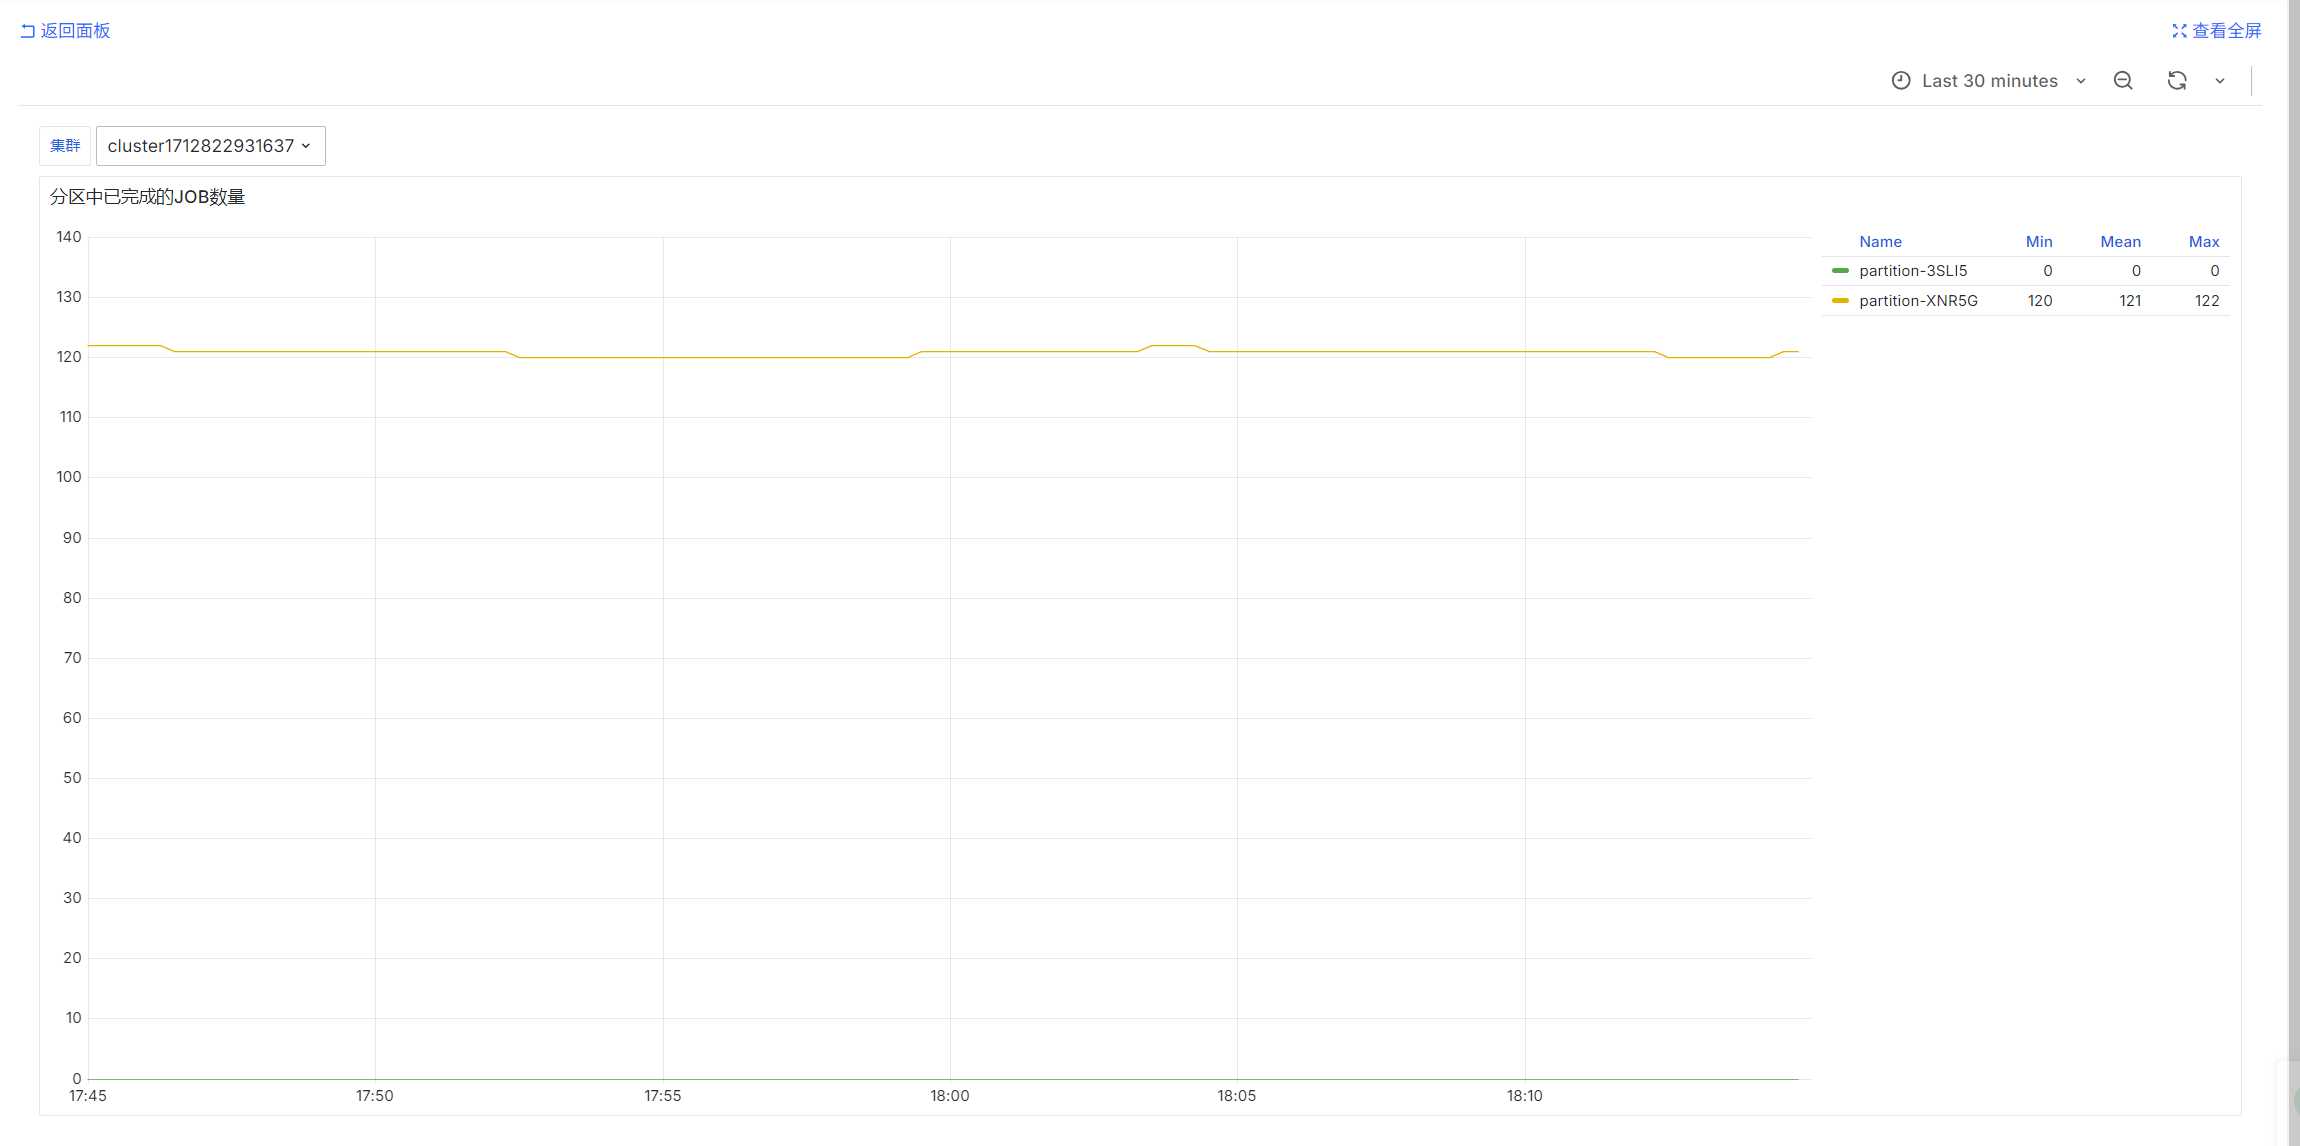
sum by (partition) (urd_job_state{cluster="$ClusterId", state='COMPLETED'})
urd periodically queries jobs in each cluster and counts their states. These are instantaneous values.
Operations Overview
User Dimension
User Usage in Cluster Mode
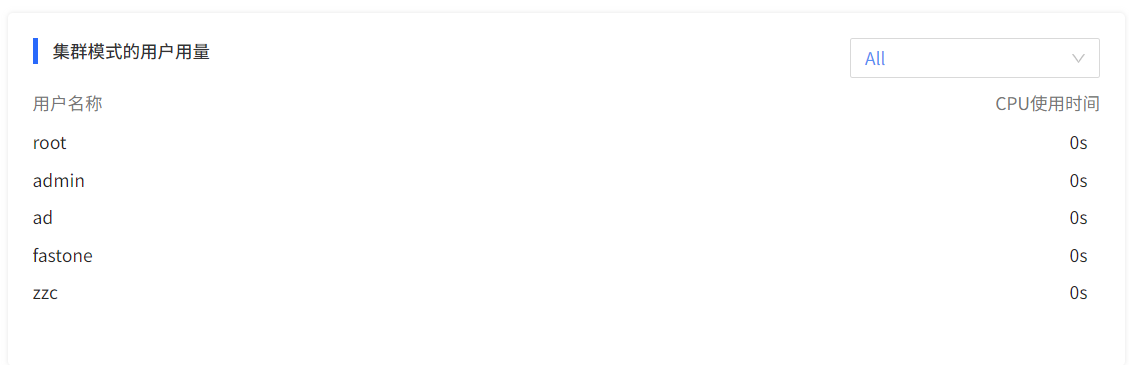
SELECT
username,
sum(usage) as usage
from user_usages
where end_time > ? and end_time < ? and (? = '' or cluster = ?)
group by username
order by usage desc