FCP-Suite监控架构
监控架构
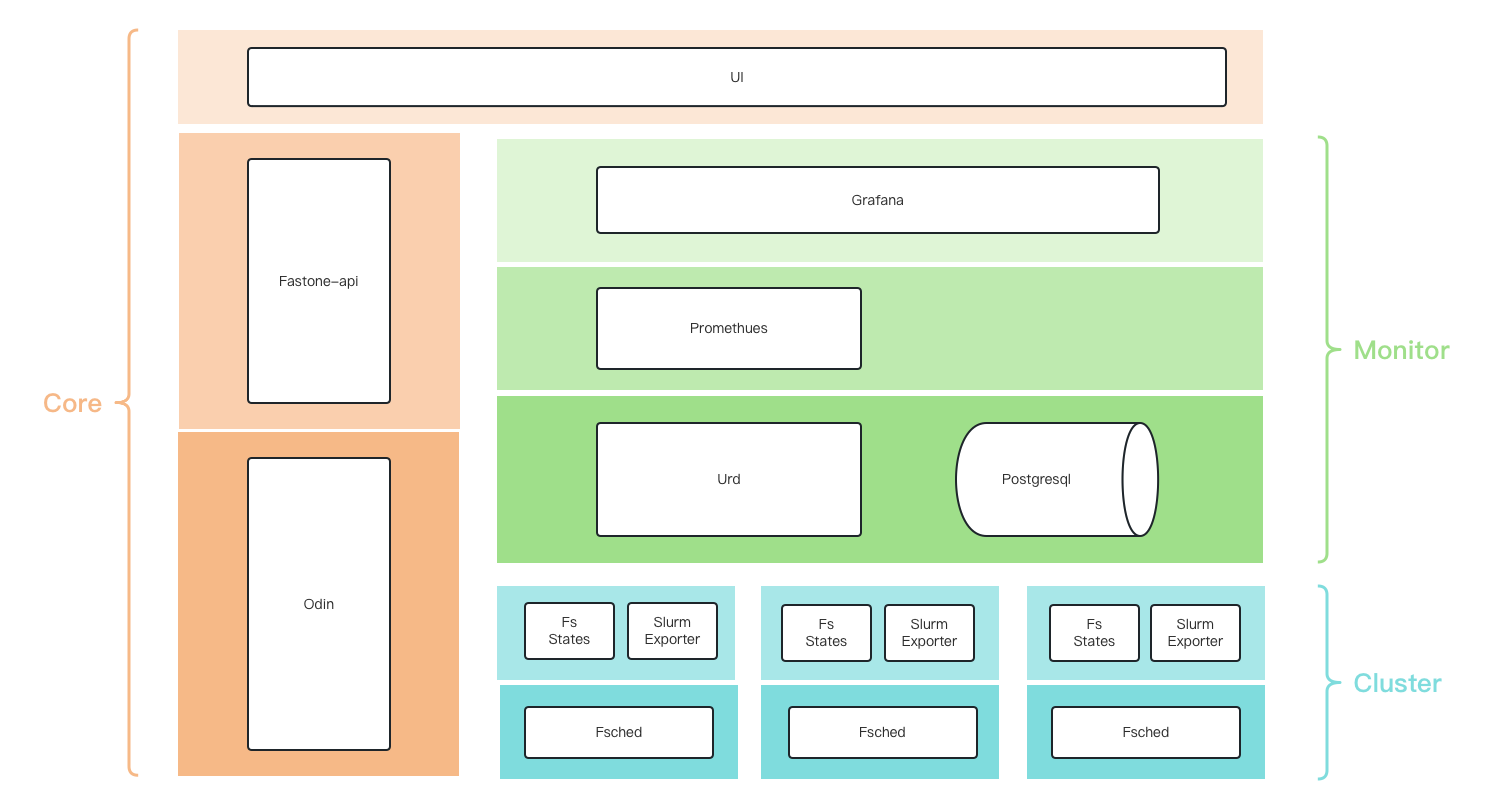
数据流
fs-states-svc:以一定的规则定期从slurm缓存jobsurd:从各个集群的头结点的fs-states-svc服务同步jobs,并存储在db中promethues:- 定期从
urd采集数据 - 定期从
slurm-export采集数据
- 定期从
grafana:连接promethues和urd的db,展示数据
fs-states-svc
查slurm api,相当于:
- squeue、scontorl
- sacct
Urd
tables
- clusters:集群表,从odin同步
- head_nodes:头结点表,从odin同步
- jobs:任务表,从fs-states-svc同步
- user_usages: 集群、分区、用户的用量表,定期从jobs中结存的数据
- usage,实际cpu用量
- req_usage,请求的cpu用量
- 每天最大可能以max(分区)*max(用户)的量级增长,计划按月分区
user_usages
数据表
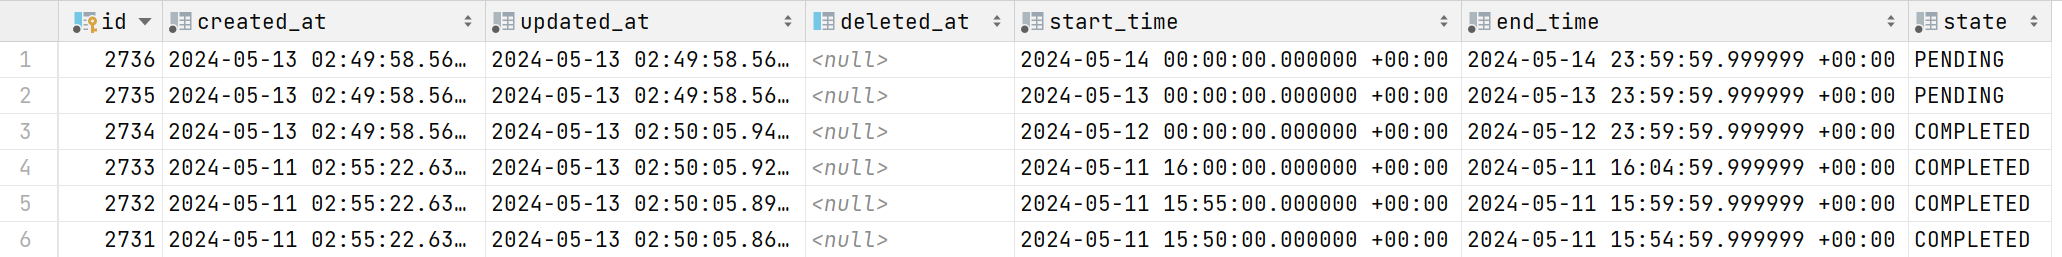
time_records    时间切片表
    start_time    切片开始时间
    end_time      切片结束时间
    state         切片状态
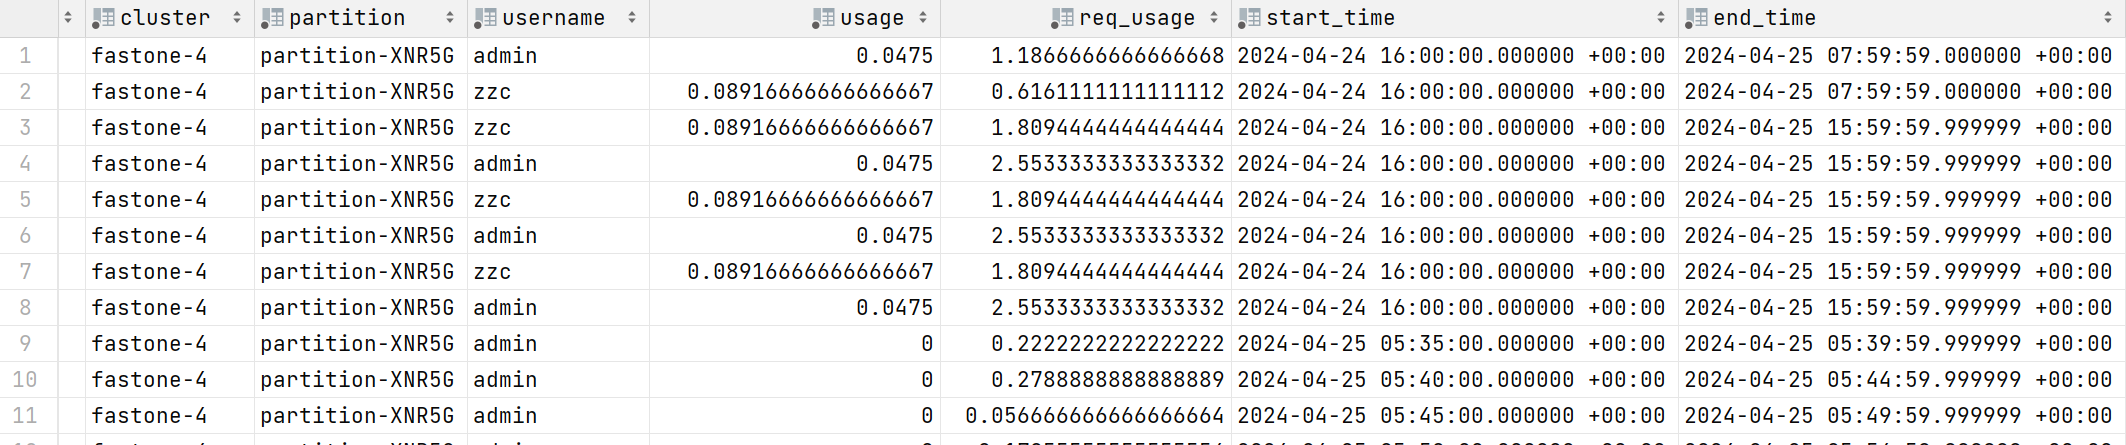
user_usages     用户用量表
    cluster       集群
    partition     分区
    username      用户
    usage         用量
    req_usage     申请用量
    start_time    开始时间
    end_time      结束时间
实现细节
定时生成时间切片
urd会定时生成时间切片记录到time_records表中,用来记录要统�计的时间范围和状态
start_time表示切片开始时间,end_time表示切片结束时间,state表示切片状态
PENDING表示未开始统计,COMPLETED表示已完成统计
目前生产环境生成的时间切片间隔是一天,测试环境通过环境变量TIME_SPLIT_BY_FIVE_MINUTES设置为true调整为5分钟
定时根据时间切片统计用户用量
urd定时查询time_records表中今天以前的PENDING的时间段,计算这一时间范围内的已完成任务的用户用量

由于收集job数据会有延迟,如果今天一结束就统计用量,可能会漏掉最后几分钟完成的任务
因此会延迟一段时间再统计用户用量,例如凌晨2点才会统计昨天的用户用量,测试环境通过环境变量TIME_SPLIT_BY_FIVE_MINUTES设置为true调整为30分钟

由于jobs表数据量太大,以日均500w、保存90天来算一共有4.5亿数据,如果一次查完会让db负载过高、内存不足影响正常使用
而jobs表使用了任务提交时间进行了分区,所以将单次查询的时间范围限制在一张分区表内,进行多次查询,以提高查询效率
测试500w数据量的表进行查询,单次查询时间在20秒左右,查询90天的数据需要30分钟左右
SELECT
			username, cluster, queue as partition,
			SUM(cur_cpu)::FLOAT as usage,
			SUM(exec_dur * req_cpu)::FLOAT as req_usage
			from jobs
			where status = ?
			-- 限制查询范围在一张分区表内
			and submit_at > ? and submit_at < ?
			and end_at > ? and end_at < ?
			group by username, cluster, partition
jobs
- 以
Table Partition的形式存储- 以天为单位建立partition
- 默认保存90天,超过90天的数据从主表中剥离
- 从主表中剥离的表,变为离散的独立表,
jobs_20231231
- 字段
- job_id:任务id
- job_name:任务名称
- cluster:集群名称,fastone-1
- uid:提交任务的uid
- username:提交任务的用户名
- group_id:提交任务的用户的group id
- priority:任务的优先级
- account:提交任务的账号
- qos:使用的qos
- dependency:任务的依赖
- queue:任务队列,分区
- status:任务状态
- command:提交任务的command,命令+参数
- submit_host:提交任务的主机
- exec_host:执行任务的主机,多个用逗号分隔
- cwd:当前工作目录
- submit_at:任务提交时间
- start_at:任务开始是时间
- end_at:任务结束时间
- wait_dur:任务等待时长,单位秒
- exec_dur:任务执行时长,单位秒
- exit_code:退出码
- exit_sig:退出信号
- reason:任务pending/suspended/exit的原因
- wckey:wckey
- req_mem:期望的内存,单位Byte
- req_node:期望的节点数量
- req_cpu:期望的cpu数量
- run_time:任务已运行的时间,单位秒
- time_limit:最大运行时间,单位秒
- eligible_time:有条件允许的时间
- accrue_time:开始为优先级累计时间的时刻
- deadline:设置的deadline
- req_nodes:请求的节点列表
- exc_nodes:排除的节点列表
- max_cpus:任务可用的最大cpu数
- max_nodes:任务可用的最大节点数
- num_tasks:请求的task数
- tres_req_str:请求的资源,cpu=1,mem=1G,node=1
- tres_alloc_str:分配的资源,cpu=1,mem=1G,node=1
- pn_min_cpus:每节点最小cpu数
- pn_min_momory:每节点最小内存,单位Byte
- liceses:请求的licenses
- std_err:stderr文件路径
- std_in:stdin文件路径
- std_out:stdout文件路径
- alloc_cpu:分配的cpu数量
- cur_node:当前任务执行的节点数量
- peak_mem_per_task:任务执行的单��个task的内存峰值,单位Byte
- avg_mem:任务执行的内存均值,单位Byte
- cur_cpu:任务执行的cpu时间,单位秒
UI-Grafana的数据来源
集群监控
集群概览
集群作业状态数量
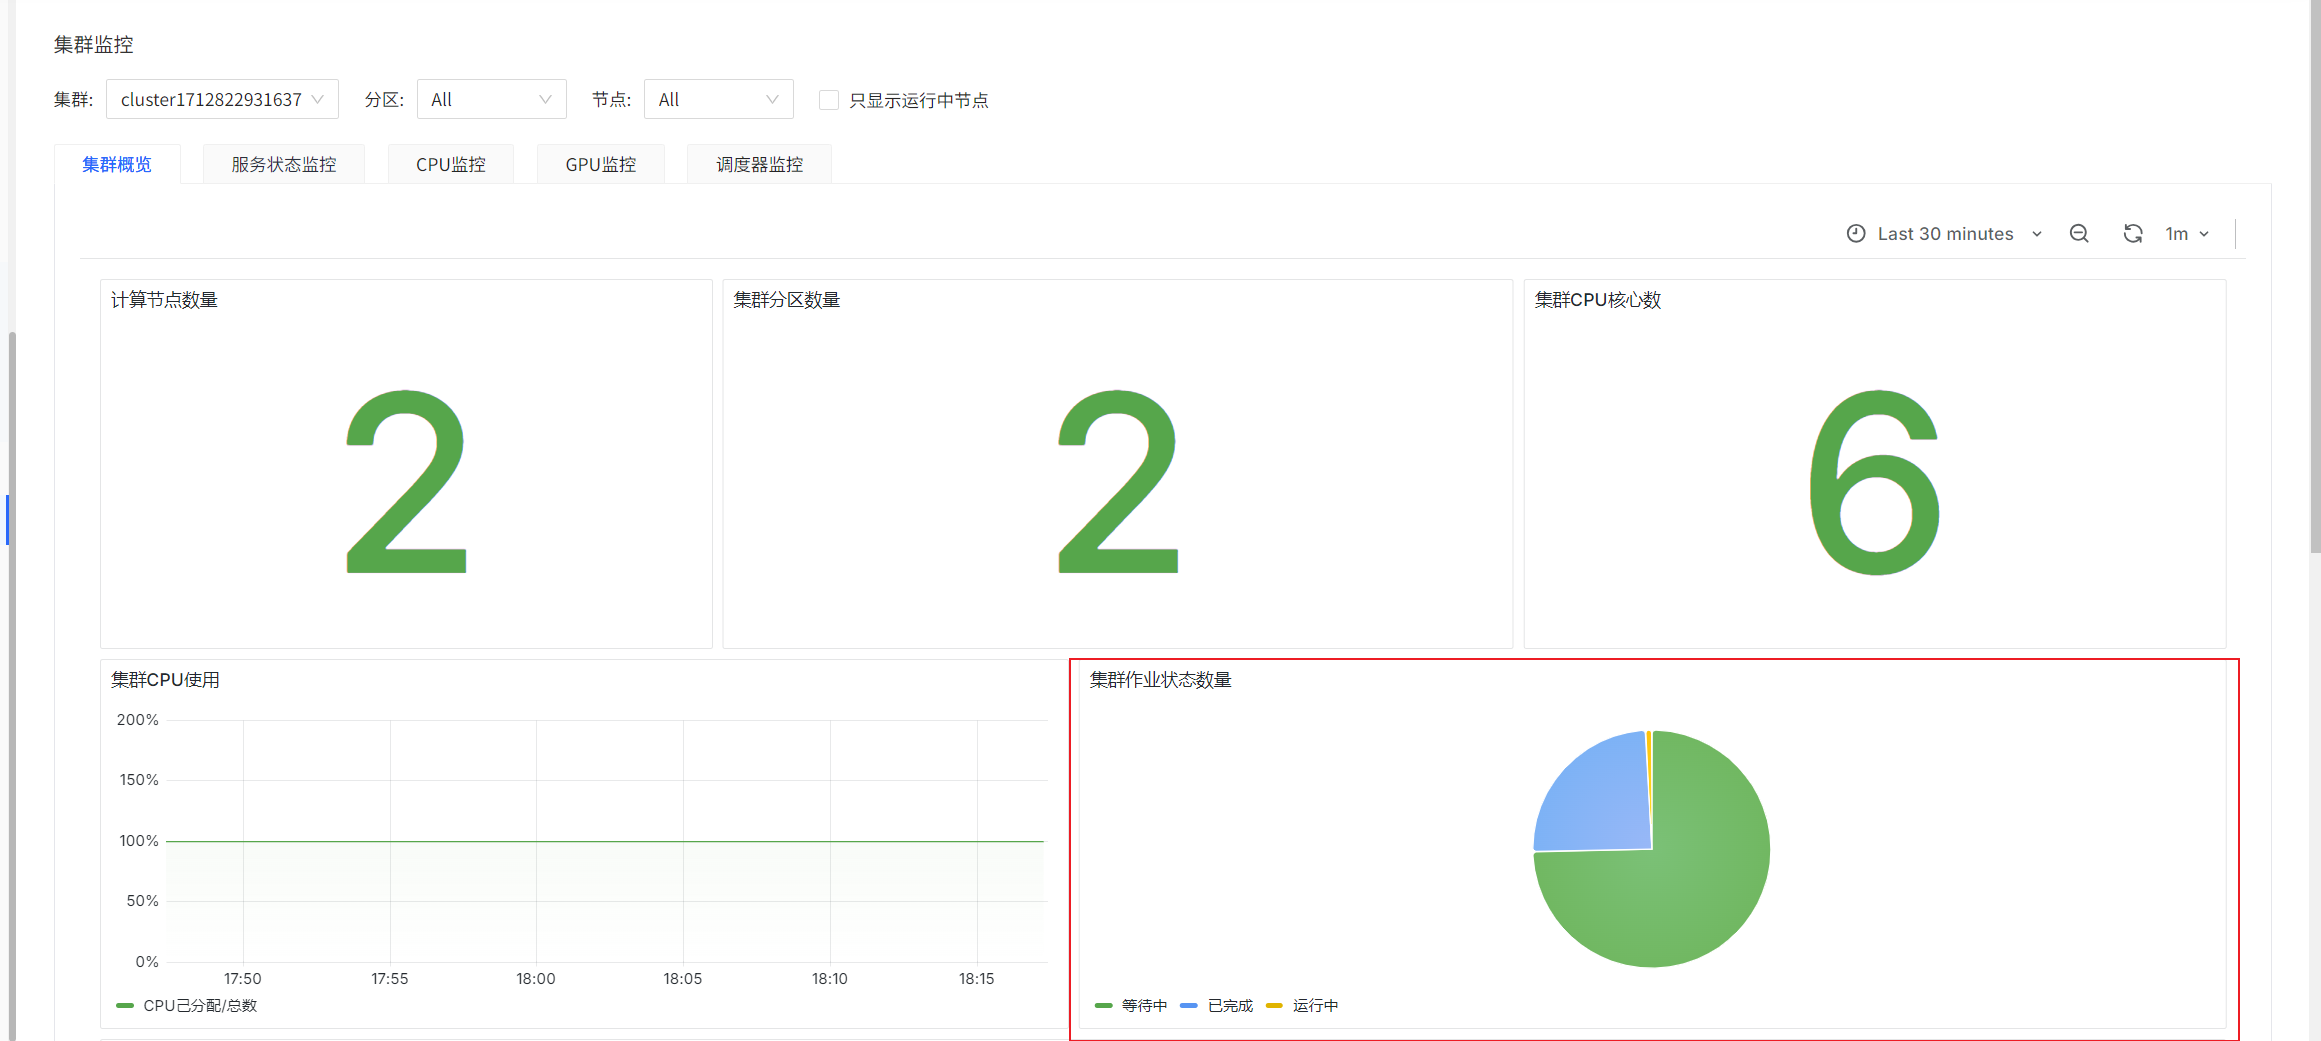
sum(slurm_partition_jobs_pending{clusterId='$clusterId'})
sum(slurm_partition_jobs_running{clusterId='$clusterId'})
sum(slurm_partition_jobs_completed{clusterId='$clusterId'})
prometheus-slurm-exporter定期查询集群的job状态并统计数量,统计的是瞬时值
分区列表--等待中的JOB平均等待时长

label_replace(avg by(partition)(slurm_partition_jobs_pending_wait_time{clusterId=~"$clusterId",partition=~"$partitionName",nodeId=~"$nodeId"}),"partitionName","$1","partition","(.*)")
prometheus-slurm-exporter定期查询集群的等待中的job并统计等待时间,统计的是瞬时值
分区等待中的JOB数量 & 分区运行中的JOB数量
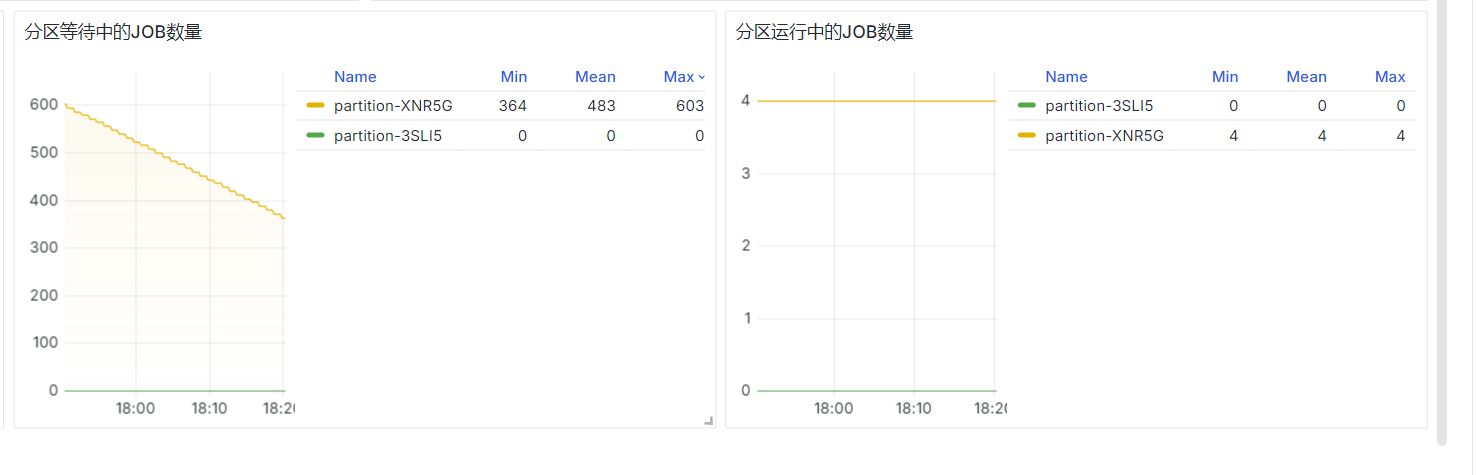
sum by (partition)(slurm_partition_jobs_pending{clusterId="$clusterId"})
sum by (partition)(slurm_partition_jobs_running{clusterId="$clusterId"})
prometheus-slurm-exporter定期查询集群的job状态并统计数量,统计的是瞬时值
集群分析
10分钟已完成的JOB执行时间

SELECT
queue as "分区",
DATE_TRUNC('second', AVG(end_at - start_at)) as "平均执行时间(HH:mm:ss)",
DATE_TRUNC('second', AVG(start_at - submit_at)) as "平均等待时间(HH:mm:ss)"
from
jobs
where submit_at > (CURRENT_TIMESTAMP - INTERVAL '30 days')
 and status = 'COMPLETED'
 and cluster = 'fastone-$ClusterId'
 and end_at > (CURRENT_TIMESTAMP - INTERVAL '600 seconds')
GROUP BY queue
;
等待中&运行中的JOB
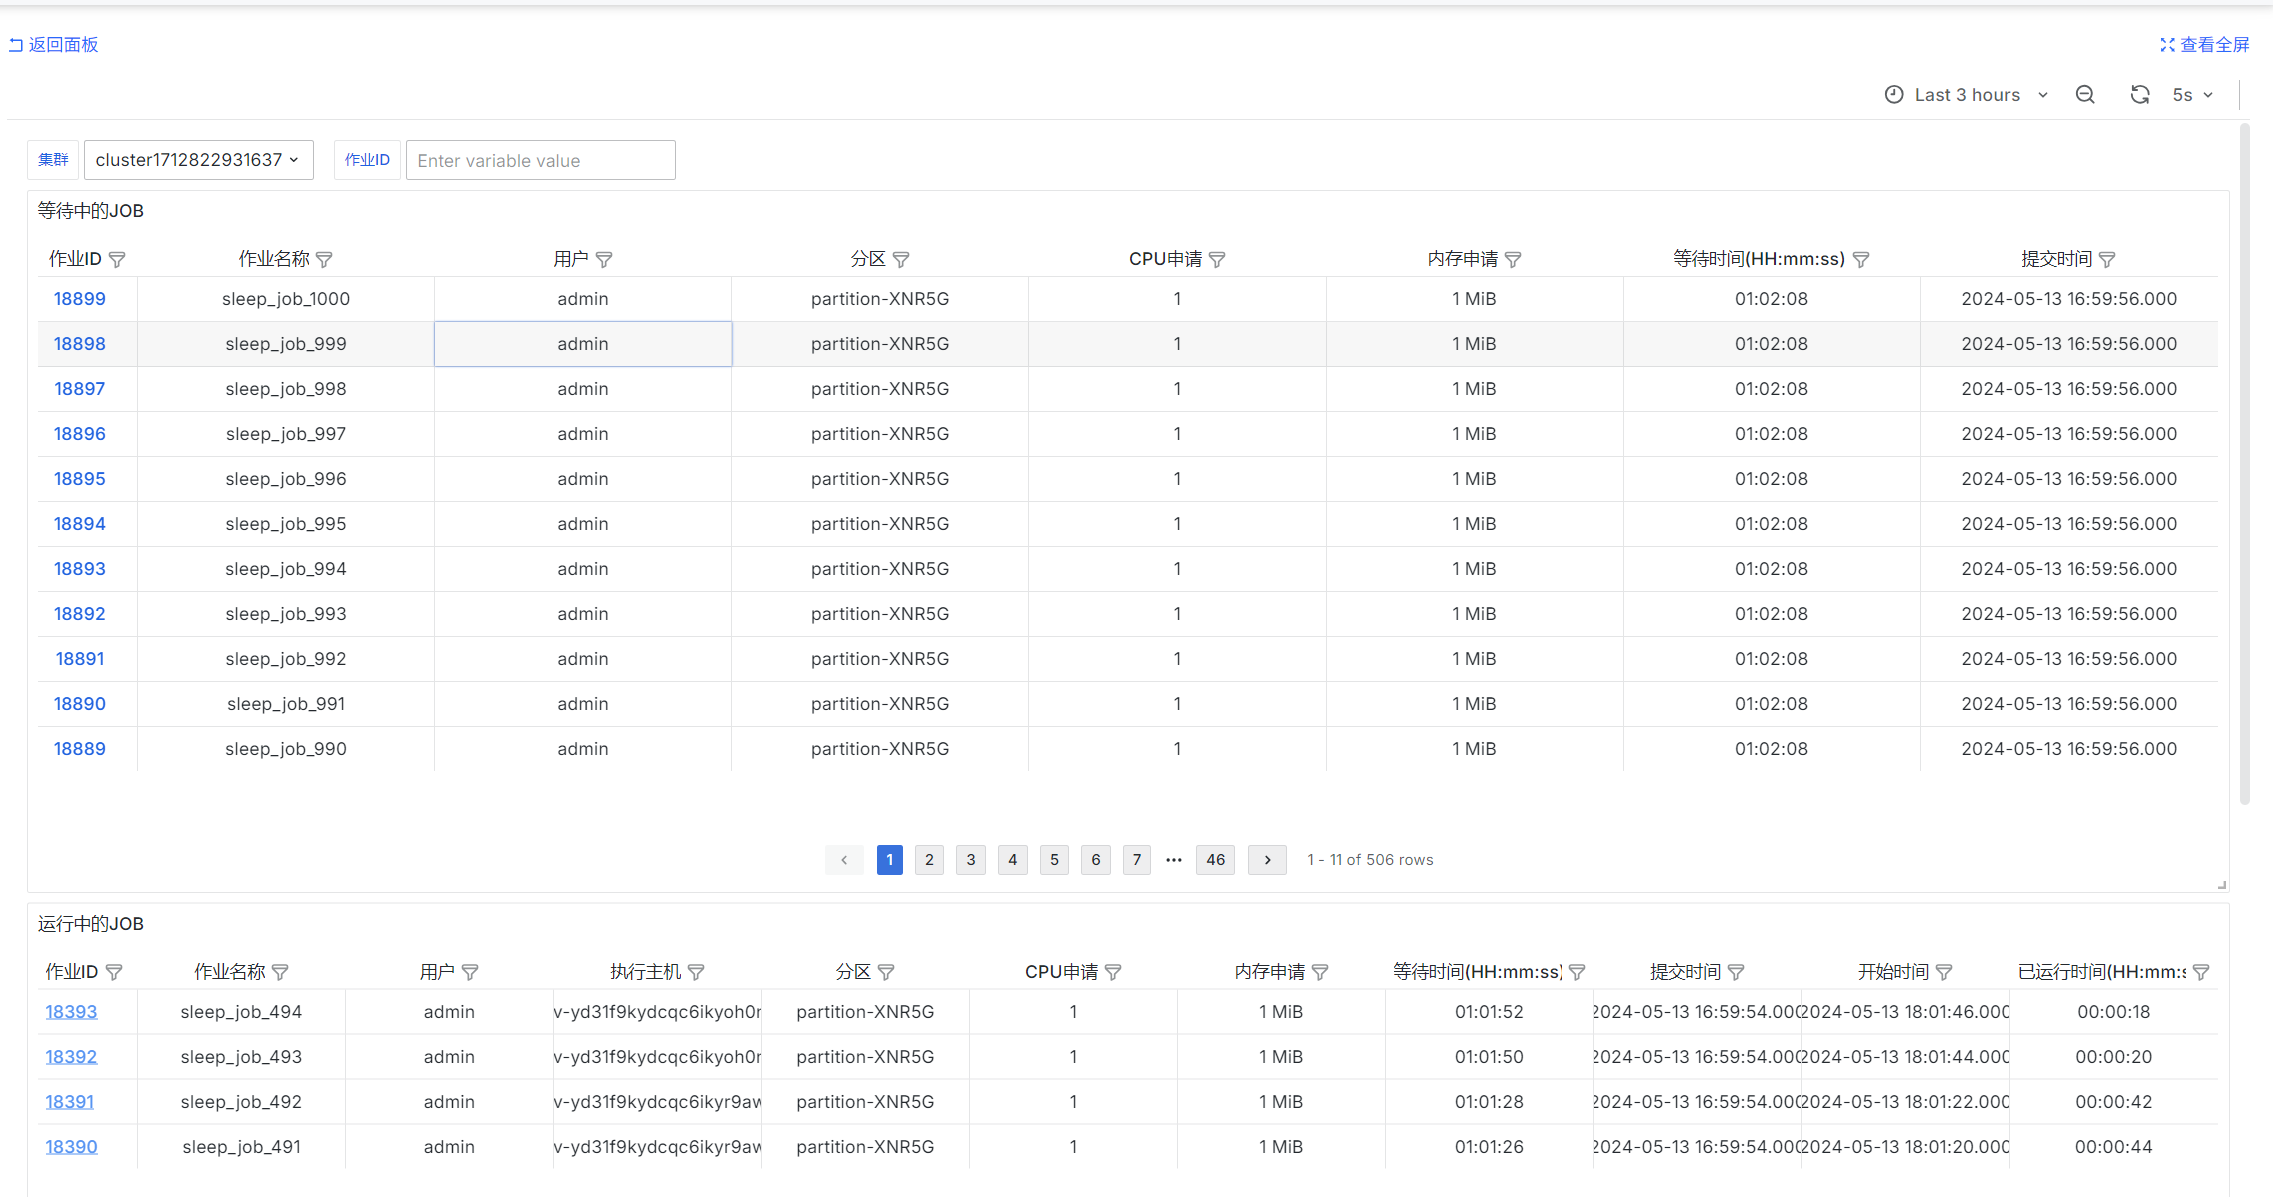 等待中的JOB
select
job_id as "作业ID",
job_name as "作业名称",
username as "用户",
queue as "分区",
req_cpu as "CPU申请",
req_mem as "内存申请",
DATE_TRUNC('second', CURRENT_TIMESTAMP - submit_at) as "等待时间(HH:mm:ss)",
submit_at as "提交时间"
FROM
jobs
where
$__timeFilter(submit_at)
and status = 'PENDING'
and cluster = 'fastone-$ClusterId'
and ('$JobId' = '' or job_id = '$JobId')
and ('$IsAdmin' = 'true' or ('$Username' = '' or username = '$Username'))
order by job_id::int desc
limit 20000
运行中的JOB
select
job_id as "作业ID",
job_name as "作业名称",
username as "用户",
exec_host as "执行主机",
queue as "分区",
req_cpu as "CPU申请",
req_mem as "内存申请",
start_at - submit_at as "等待时间(HH:mm:ss)",
submit_at as "提交时间",
start_at as "开始时间",
DATE_TRUNC('second', CURRENT_TIMESTAMP - start_at) as "已运行时间(HH:mm:ss)"
FROM
jobs
where
$__timeFilter(submit_at)
and status = 'RUNNING'
and cluster = 'fastone-$ClusterId'
and ('$JobId' = '' or job_id = '$JobId')
and ('$IsAdmin' = 'true' or ('$Username' = '' or username = '$Username'))
order by job_id::int desc
limit 20000
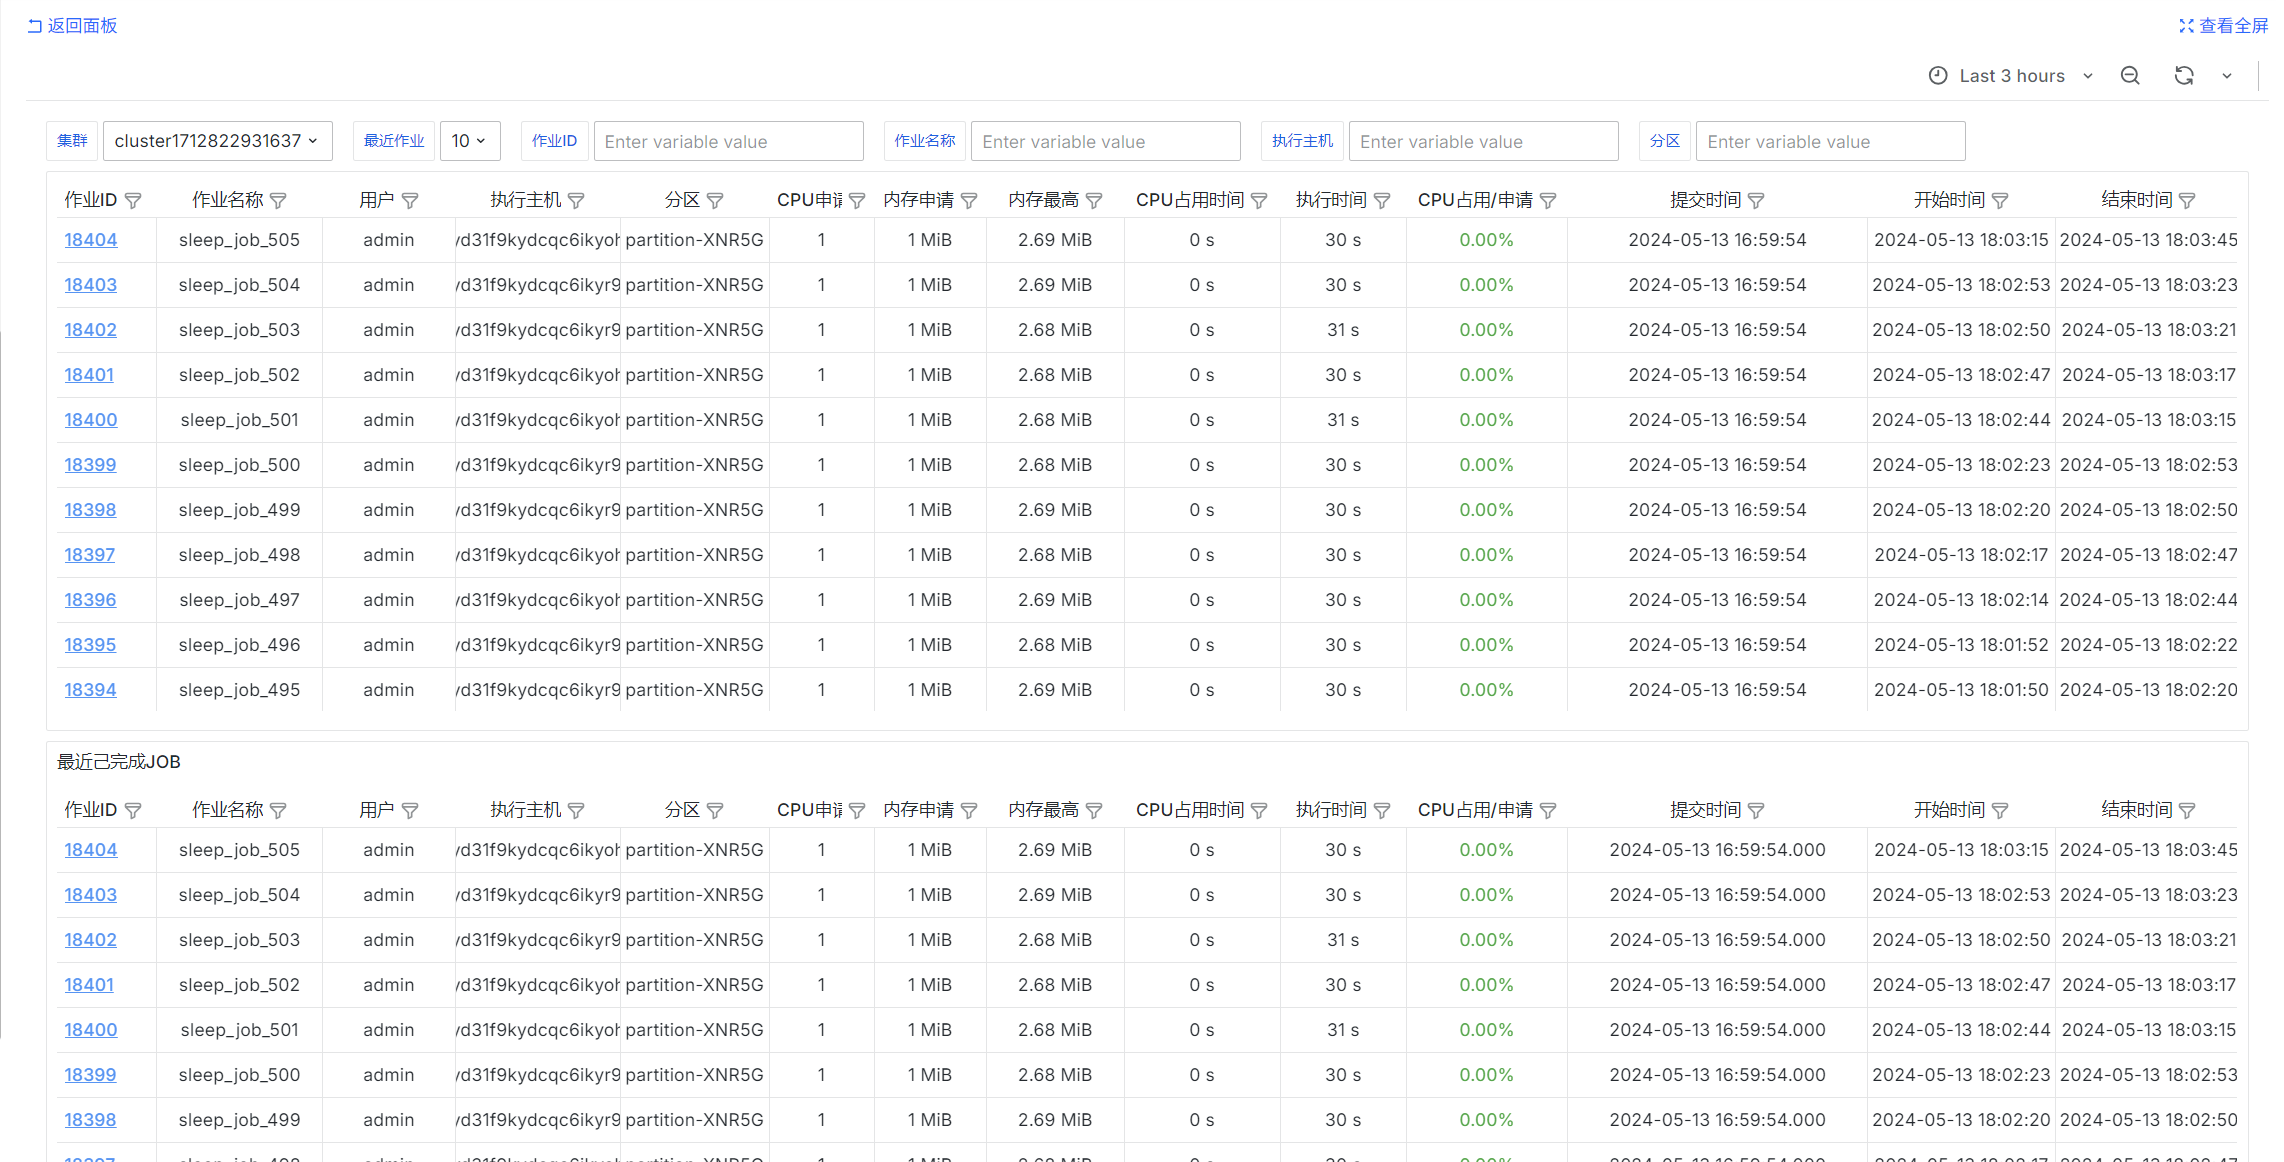
已完成JOB
select
  job_id as "作业ID",
  job_name as "作业名称",
  username as "用户",
  exec_host as "执行主机",
  queue as "分区",
  req_cpu as "CPU申请",
  req_mem as "内存申请",
  peak_mem_per_task as "内存最高",
  cur_cpu as "CPU占用时间",
  exec_dur as "执行时间",
  cur_cpu::float / NULLIF(exec_dur * req_cpu, 0) as "CPU占用/申请",
  submit_at as "提交时间",
  start_at as "开始时间",
  end_at as "结束时间",
  status as "状态"
from jobs
where
$__timeFilter(submit_at)
and cluster = 'fastone-$ClusterId'
and status not in ('PENDING', 'RUNNING', 'SUSPENDED')
AND ('$JobId' = '' OR job_id = '$JobId')
and ('$JobName' = '' or job_name = '$JobName')
and ('$IsAdmin' = 'true' or ('$Username' = '' or username = '$Username'))
and ('$Partition' = '' or queue = '$Partition')
and ('$ExecHost' = '' or exec_host = '$ExecHost')
order by job_id::int desc
limit 10000;
select
  job_id as "作业ID",
  job_name as "作业名称",
  username as "用户",
  exec_host as "执行主机",
  queue as "分区",
  req_cpu as "CPU申请",
  req_mem as "内存申请",
  peak_mem_per_task as "内存最高",
  cur_cpu as "CPU占用时间",
  exec_dur as "执行时间",
  cur_cpu::float / NULLIF(exec_dur * req_cpu, 0) as "CPU占用/申请",
  submit_at as "提交时间",
  start_at as "开始时间",
  end_at as "结束时间",
  status as "状态"
from jobs
where
$__timeFilter(submit_at)
and cluster = 'fastone-$ClusterId'
and status not in ('PENDING', 'RUNNING', 'SUSPENDED')
AND ('$JobId' = '' OR job_id = '$JobId')
and ('$JobName' = '' or job_name = '$JobName')
and ('$IsAdmin' = 'true' or ('$Username' = '' or username = '$Username'))
and ('$Partition' = '' or queue = '$Partition')
and ('$ExecHost' = '' or exec_host = '$ExecHost')
order by job_id::int desc
limit $LimitNum;
用户JOB状态查询

sum by (username) (urd_job_state{cluster='$ClusterId', state='PENDING'})
sum by (username) (urd_job_state{cluster='$ClusterId', state='RUNNING'})
sum by (username) (urd_job_state{cluster='$ClusterId', state='COMPLETED'})
sum by (username) (urd_job_state{cluster='$ClusterId', state='CANCELLED'})
sum by (username) (urd_job_state{cluster='$ClusterId', state='FAILED'})
urd定时查询每个集群的job并统计状态,统计的是瞬时值
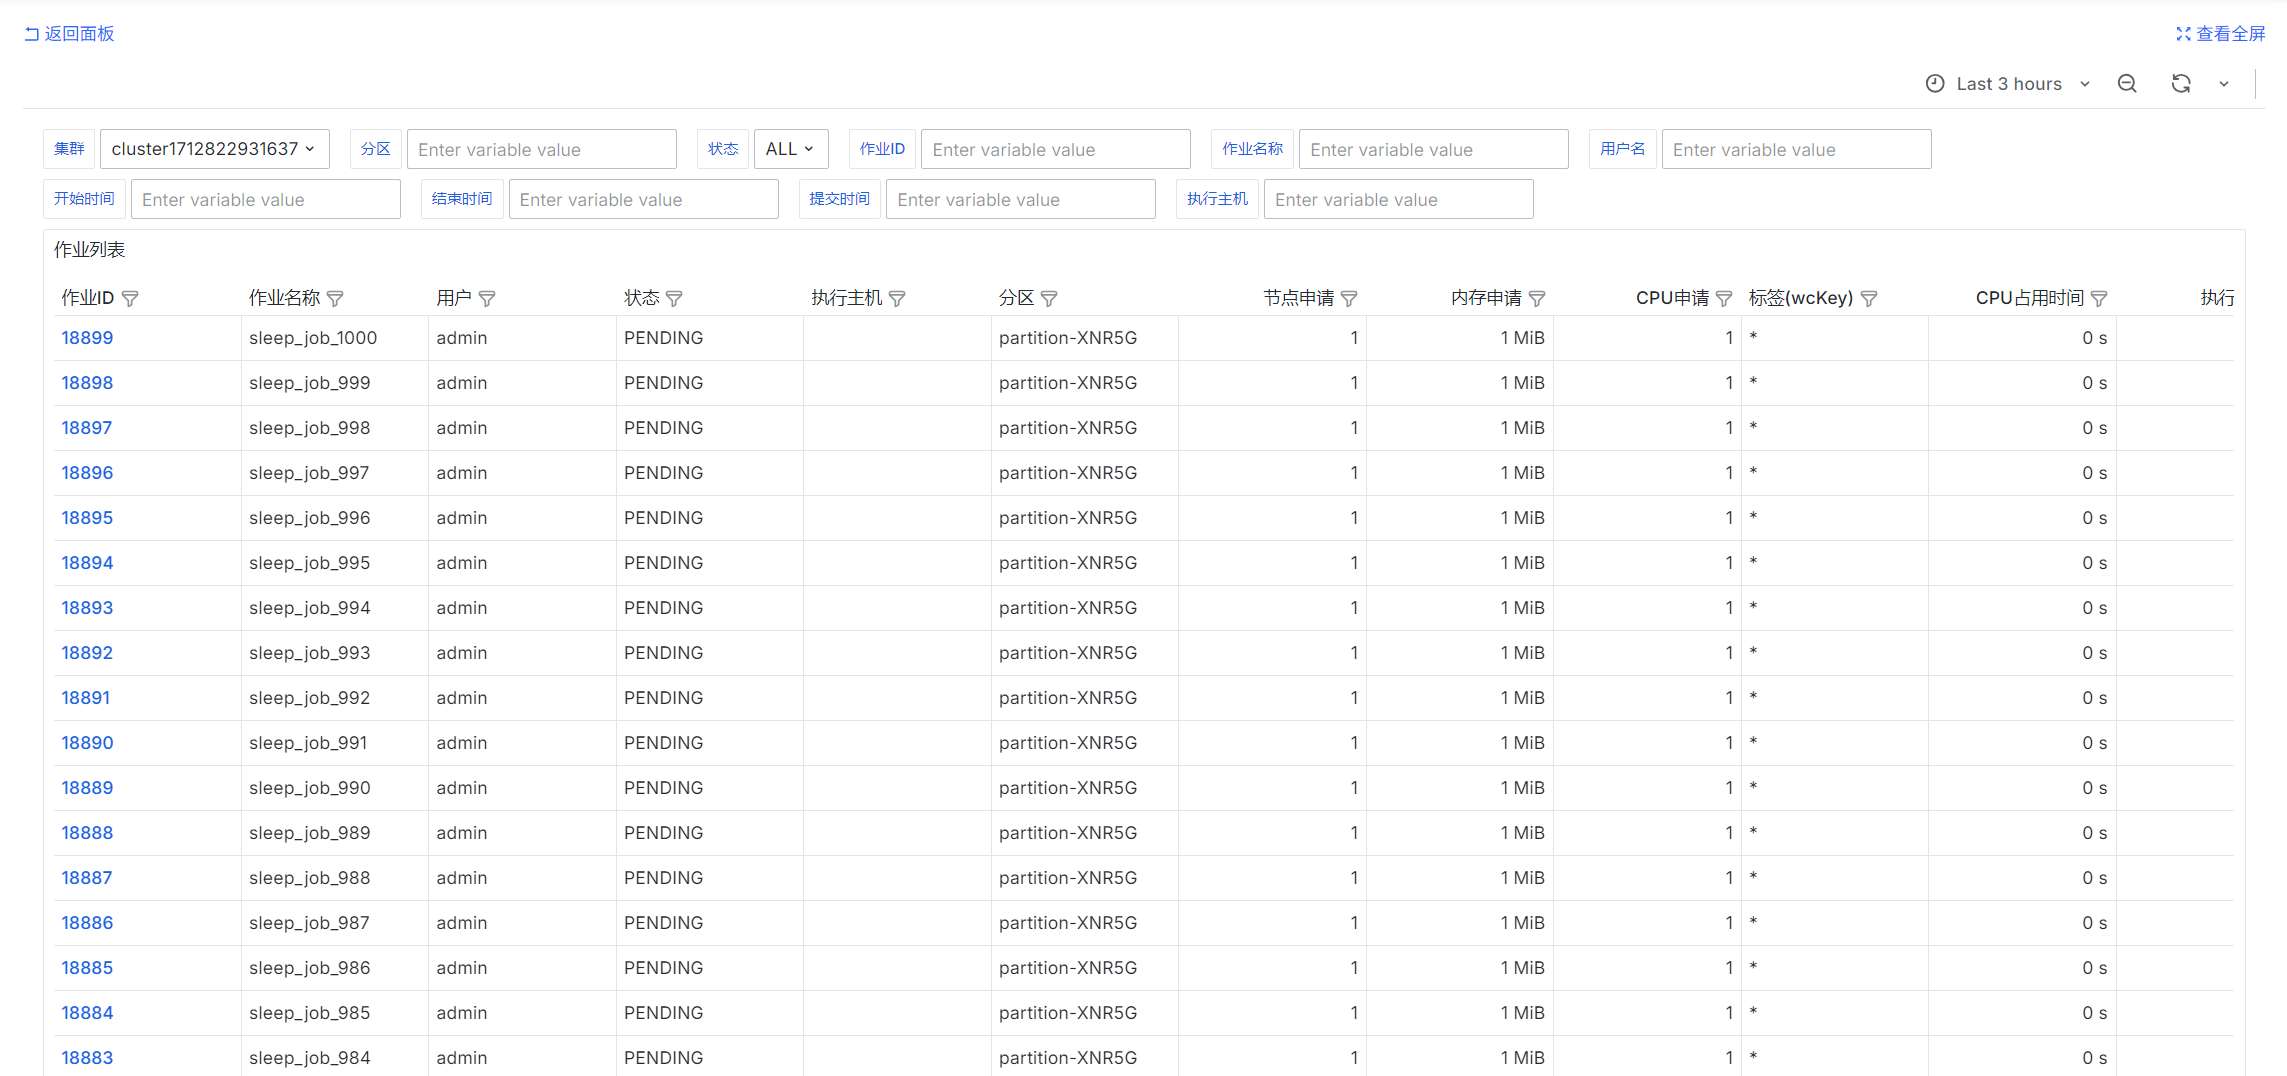
作业列表
select
  job_id as "作业ID",
  job_name as "作业名称",
  username as "用户",
  status as "状态",
  exec_host as "执行主机",
  queue as "分区",
  req_node as "节点申请",
  req_mem as "内存申请",
  req_cpu as "CPU申请",
  wckey as "标签(wcKey)",
  cur_cpu as "CPU占用时间",
  exec_dur as "执行时间",
  cur_cpu::float / NULLIF(exec_dur * req_cpu, 0) as "CPU占用/申请",
  wait_dur as "等待时间",
  submit_at as "提交时间",
  start_at as "开始时间",
  end_at as "结束时间",
  exit_code as "退出码",
  exit_sig as "退出信号"
from jobs
where
$__timeFilter(submit_at)
and cluster = 'fastone-$ClusterId'
AND ('$JobId' = '' OR job_id = '$JobId')
and ('$JobName' = '' or job_name = '$JobName')
and (('$IsAdmin' = 'true' or ('$Username' = '' or username = '$Username')) and ('$UsernameQuery' = '' or username = '$UsernameQuery'))
and ('$Partition' = '' or queue = '$Partition')
and ('$ExecHost' = '' or exec_host = '$ExecHost')
and ('$StateEn' = '' or status = '$StateEn')
and ('$SubmitAt' = '' OR submit_at < COALESCE(NULLIF('$SubmitAt', '')::timestamp, '1970-01-01 00:00:00'))
and ('$StartAt' = '' OR start_at < COALESCE(NULLIF('$StartAt', '')::timestamp, '1970-01-01 00:00:00'))
and ('$EndAt' = '' OR end_at < COALESCE(NULLIF('$EndAt', '')::timestamp, '1970-01-01 00:00:00'))
order by job_id::int desc
limit 10000;
内存指定不合理的JOB
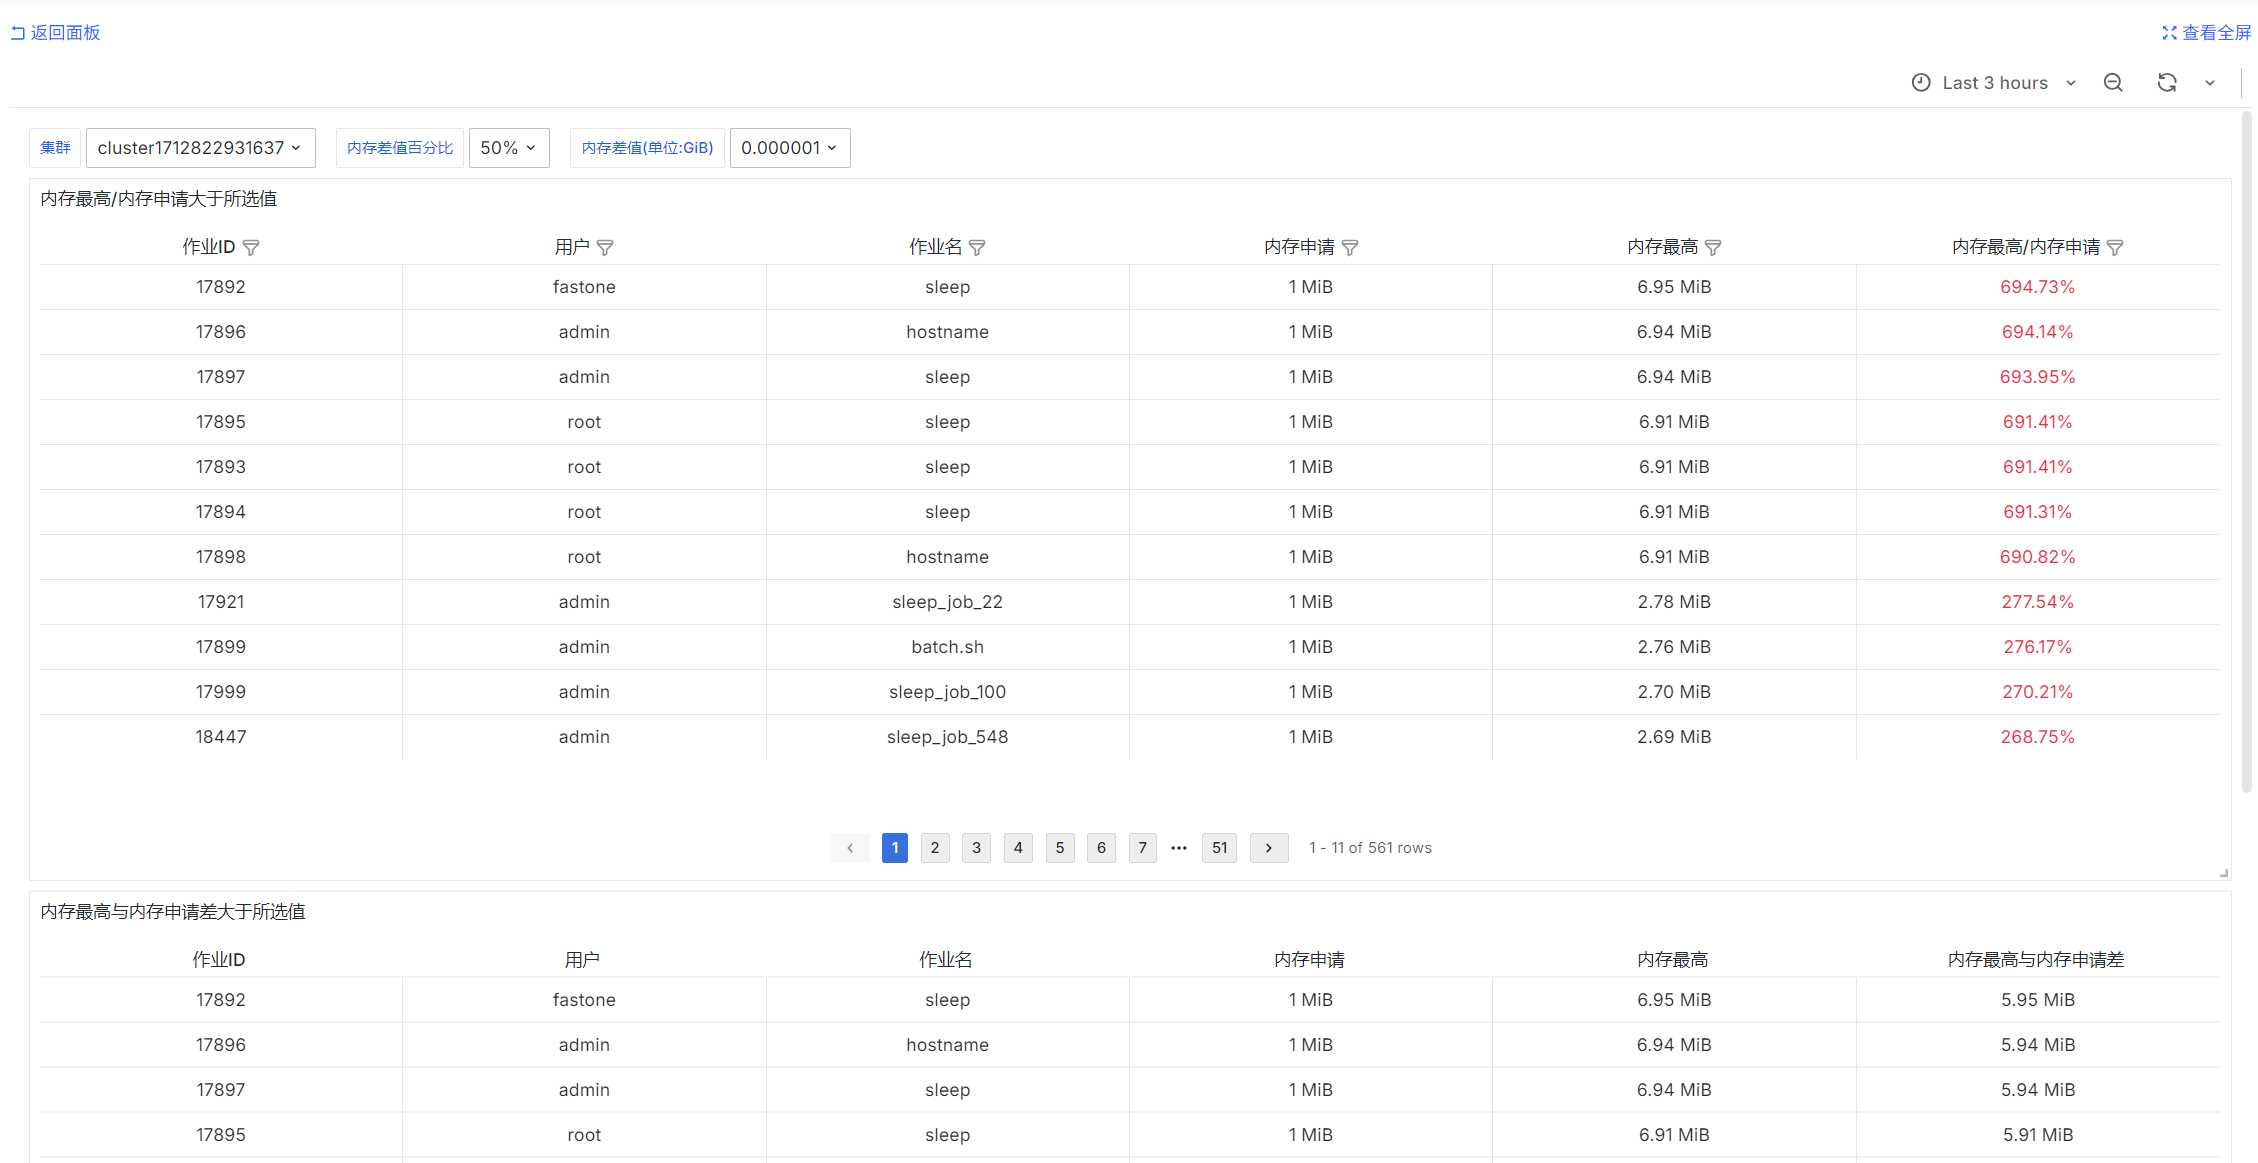
SELECT
job_id as "作业ID",
username as "用户",
job_name as "作业名",
req_mem as "内存申请",
peak_mem_per_task as "内存最高",
peak_mem_per_task::float / req_mem * 100  as "内存最高/内存申请"
FROM
jobs
where
$__timeFilter(submit_at)
and cluster = 'fastone-$ClusterId'
and status = 'COMPLETED'
and peak_mem_per_task::float / req_mem * 100 > CAST(SUBSTRING('$MemDiffPercent' FROM 1 FOR LENGTH('$MemDiffPercent') - 1) AS NUMERIC)
and ('$IsAdmin' = 'true' or ('$Username' = '' or username = '$Username'))
order by "内存最高/内存申请" desc, job_id::int desc
limit 10000
SELECT
job_id as "作业ID",
username as "用户",
job_name as "作业名",
req_mem as "内存申请",
peak_mem_per_task as "内存最高",
peak_mem_per_task - req_mem  as "内存最高与内存申请差"
FROM
jobs
where
$__timeFilter(submit_at)
and cluster = 'fastone-$ClusterId'
and status = 'COMPLETED'
and peak_mem_per_task - req_mem >= CAST('$MemDiff' as FLOAT) * 1024 * 1024 * 1024
and ('$IsAdmin' = 'true' or ('$Username' = '' or username = '$Username'))
order by "内存最高与内存申请差" desc, job_id::int desc
limit 10000
CPU指定不合理的JOB
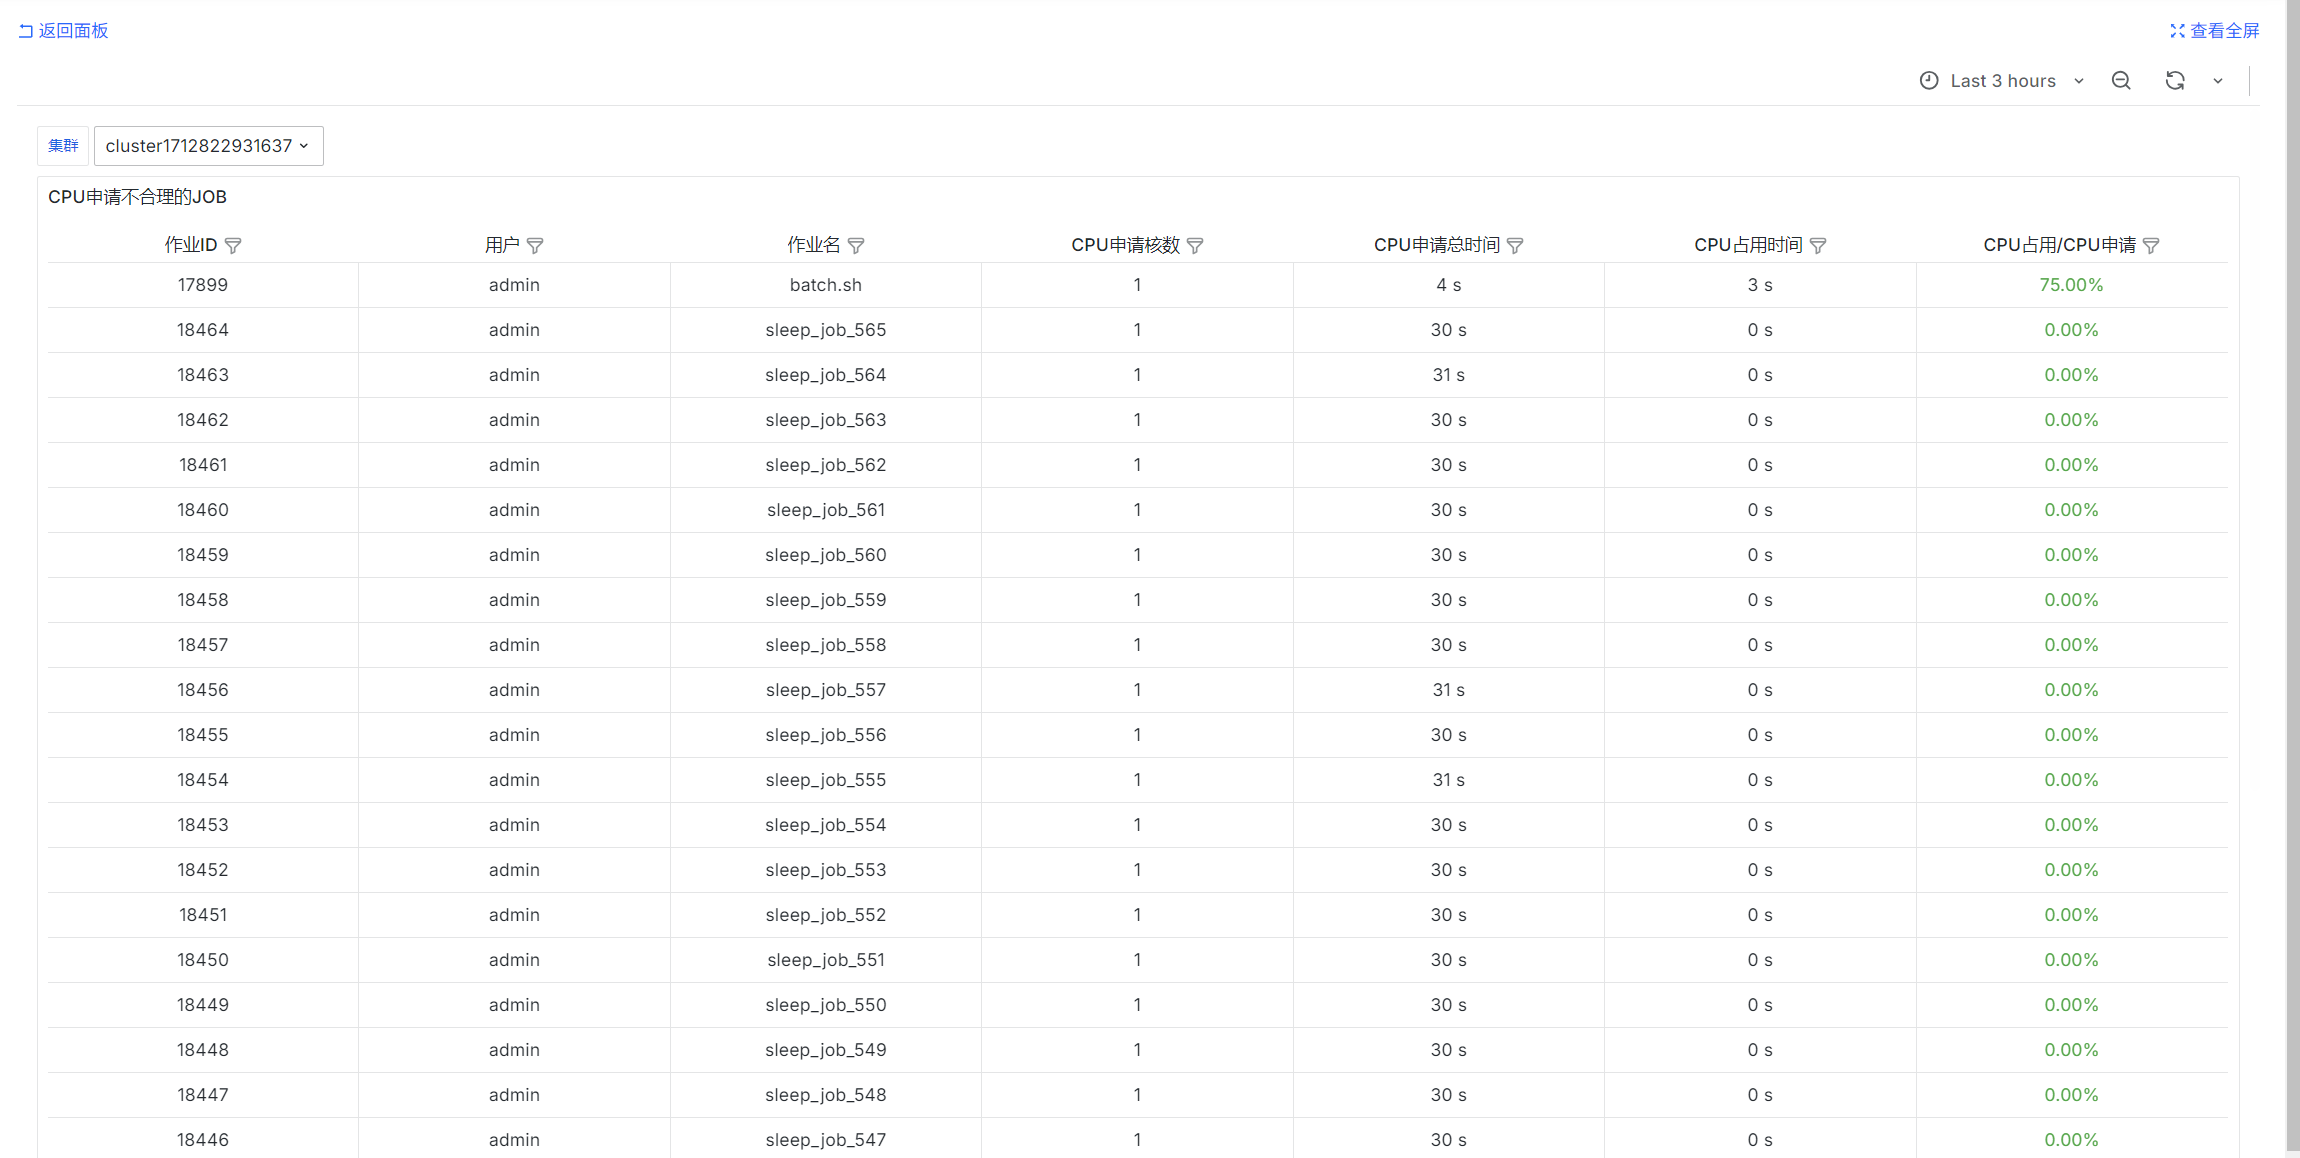
select
job_id as "作业ID",
username as "用户",
job_name as "作业名",
req_cpu as "CPU申请核数",
exec_dur * req_cpu as "CPU申请总时间",
cur_cpu as "CPU占用时间",
cur_cpu / NULLIF(exec_dur * req_cpu::float, 0) as "CPU占用/CPU申请"
from
jobs
where
$__timeFilter(submit_at)
and status = 'COMPLETED'
and cluster = 'fastone-$ClusterId'
and ('$IsAdmin' = 'true' or ('$Username' = '' or username = '$Username'))
order by "CPU占用/CPU申请" desc NULLS LAST, job_id desc
limit 10000;
用户用量统计
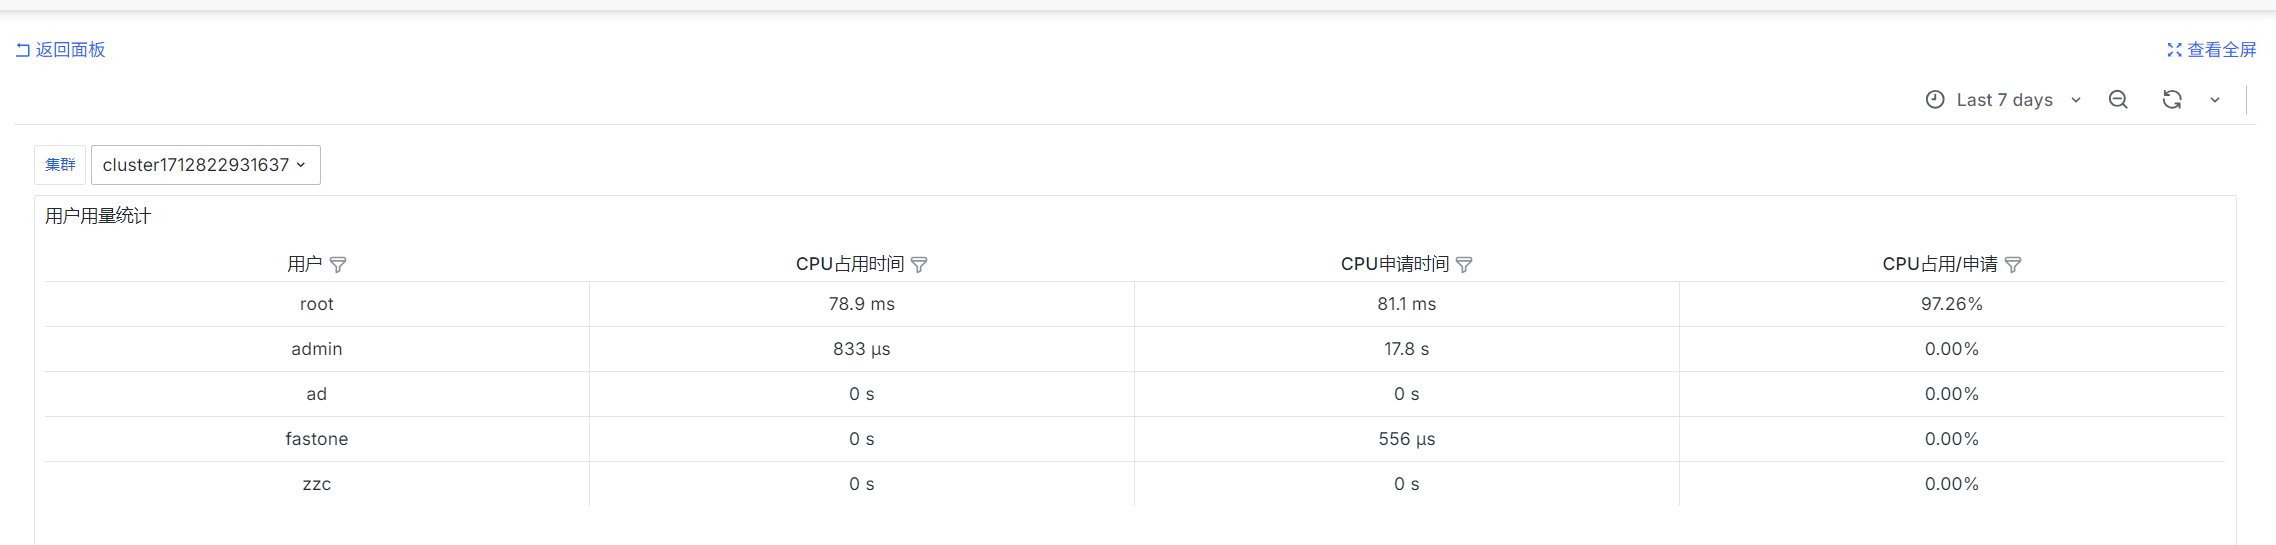
SELECT
username as "用户",
sum(usage) as "CPU占用时间",
sum(req_usage) as "CPU申请时间",
sum(usage) / NULLIF(sum(req_usage), 0) as "CPU占用/申请"
from user_usages
where
$__timeFilter(end_time)
and cluster = 'fastone-$ClusterId'
and ('$IsAdmin' = 'true' or ('$Username' = '' or username = '$Username'))
group by username
order by "CPU占用时间" desc
异常退出的JOB
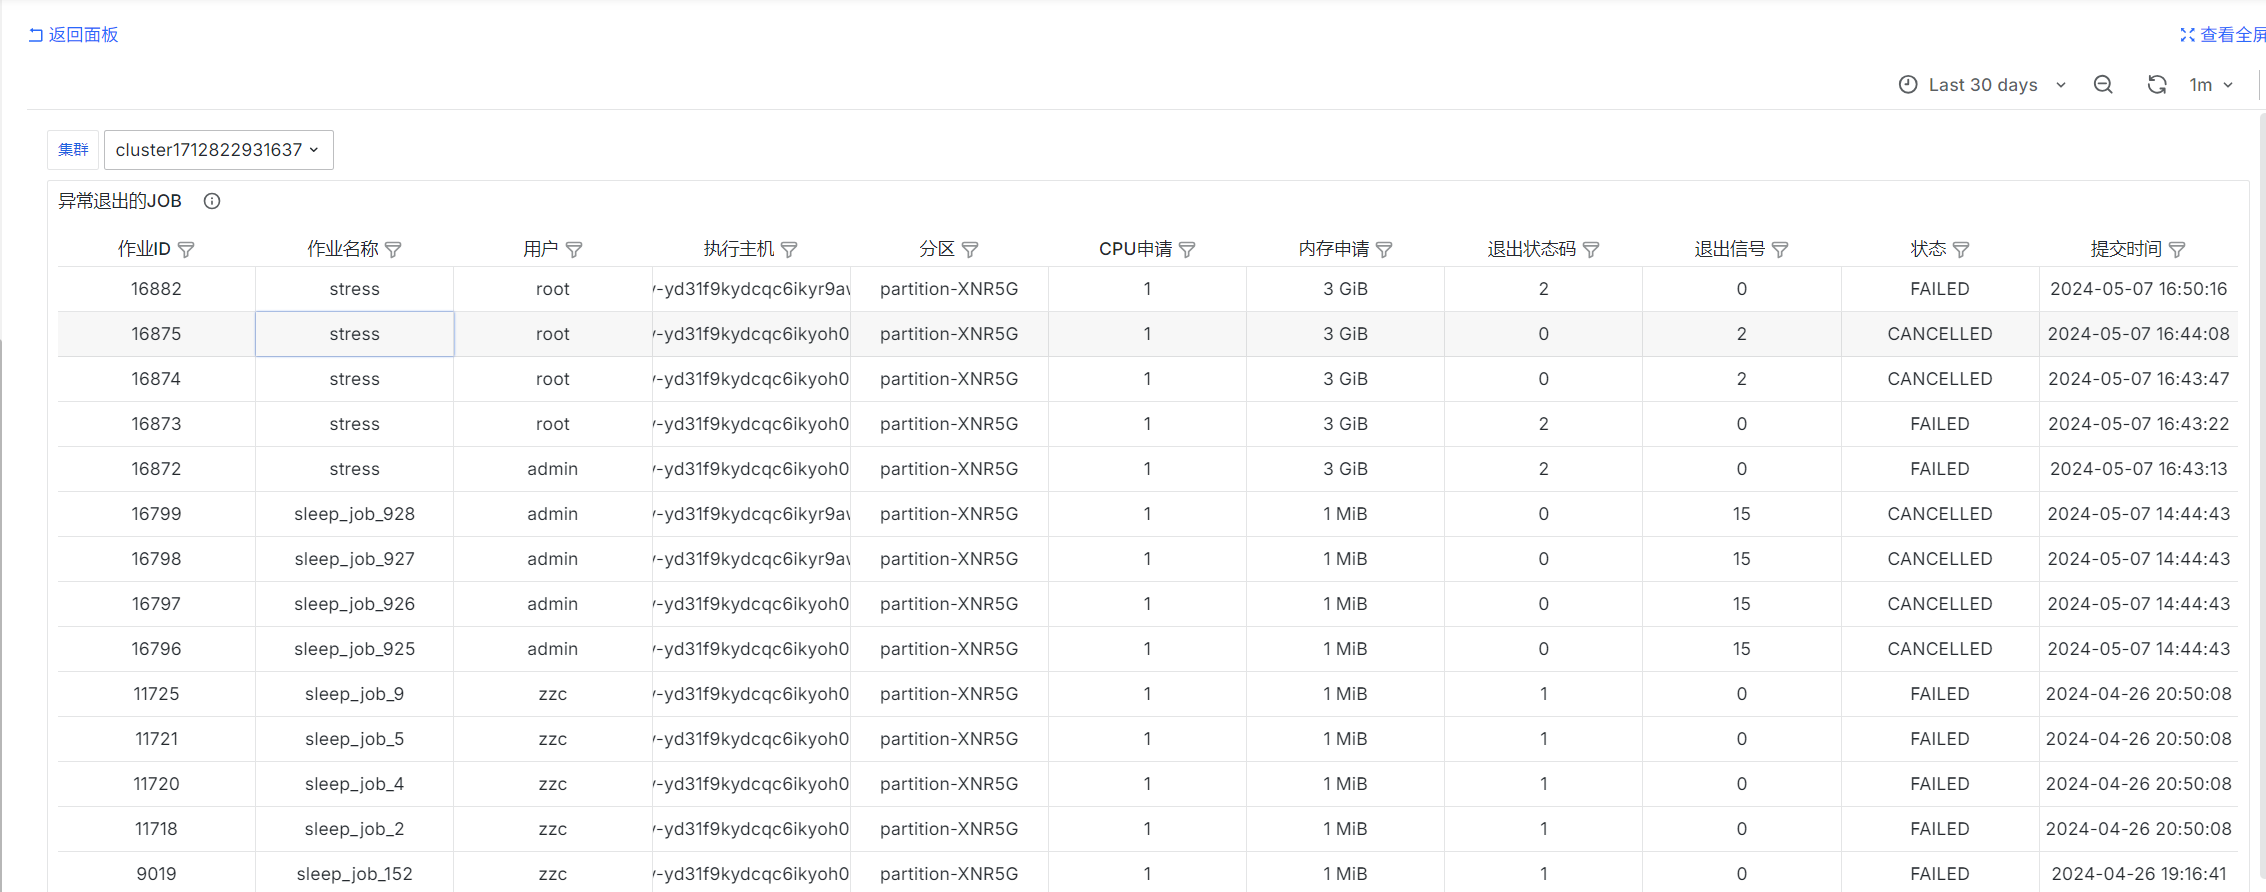
select
job_id as "作业ID",
job_name as "作业名称",
username as "用户",
exec_host as "执行主机",
queue as "分区",
req_cpu as "CPU申请",
req_mem as "内存申请",
exit_code as "退出状态码",
exit_sig as "退出信号",
status as "状态",
submit_at as "提交时间"
from jobs
where
$__timeFilter(submit_at)
and (exit_code != 0 or exit_sig != 0)
and cluster = 'fastone-$ClusterId'
and ('$IsAdmin' = 'true' or ('$Username' = '' or username = '$Username'))
order by job_id::int desc
limit 10000;
集群等待中的JOB平均等待时长
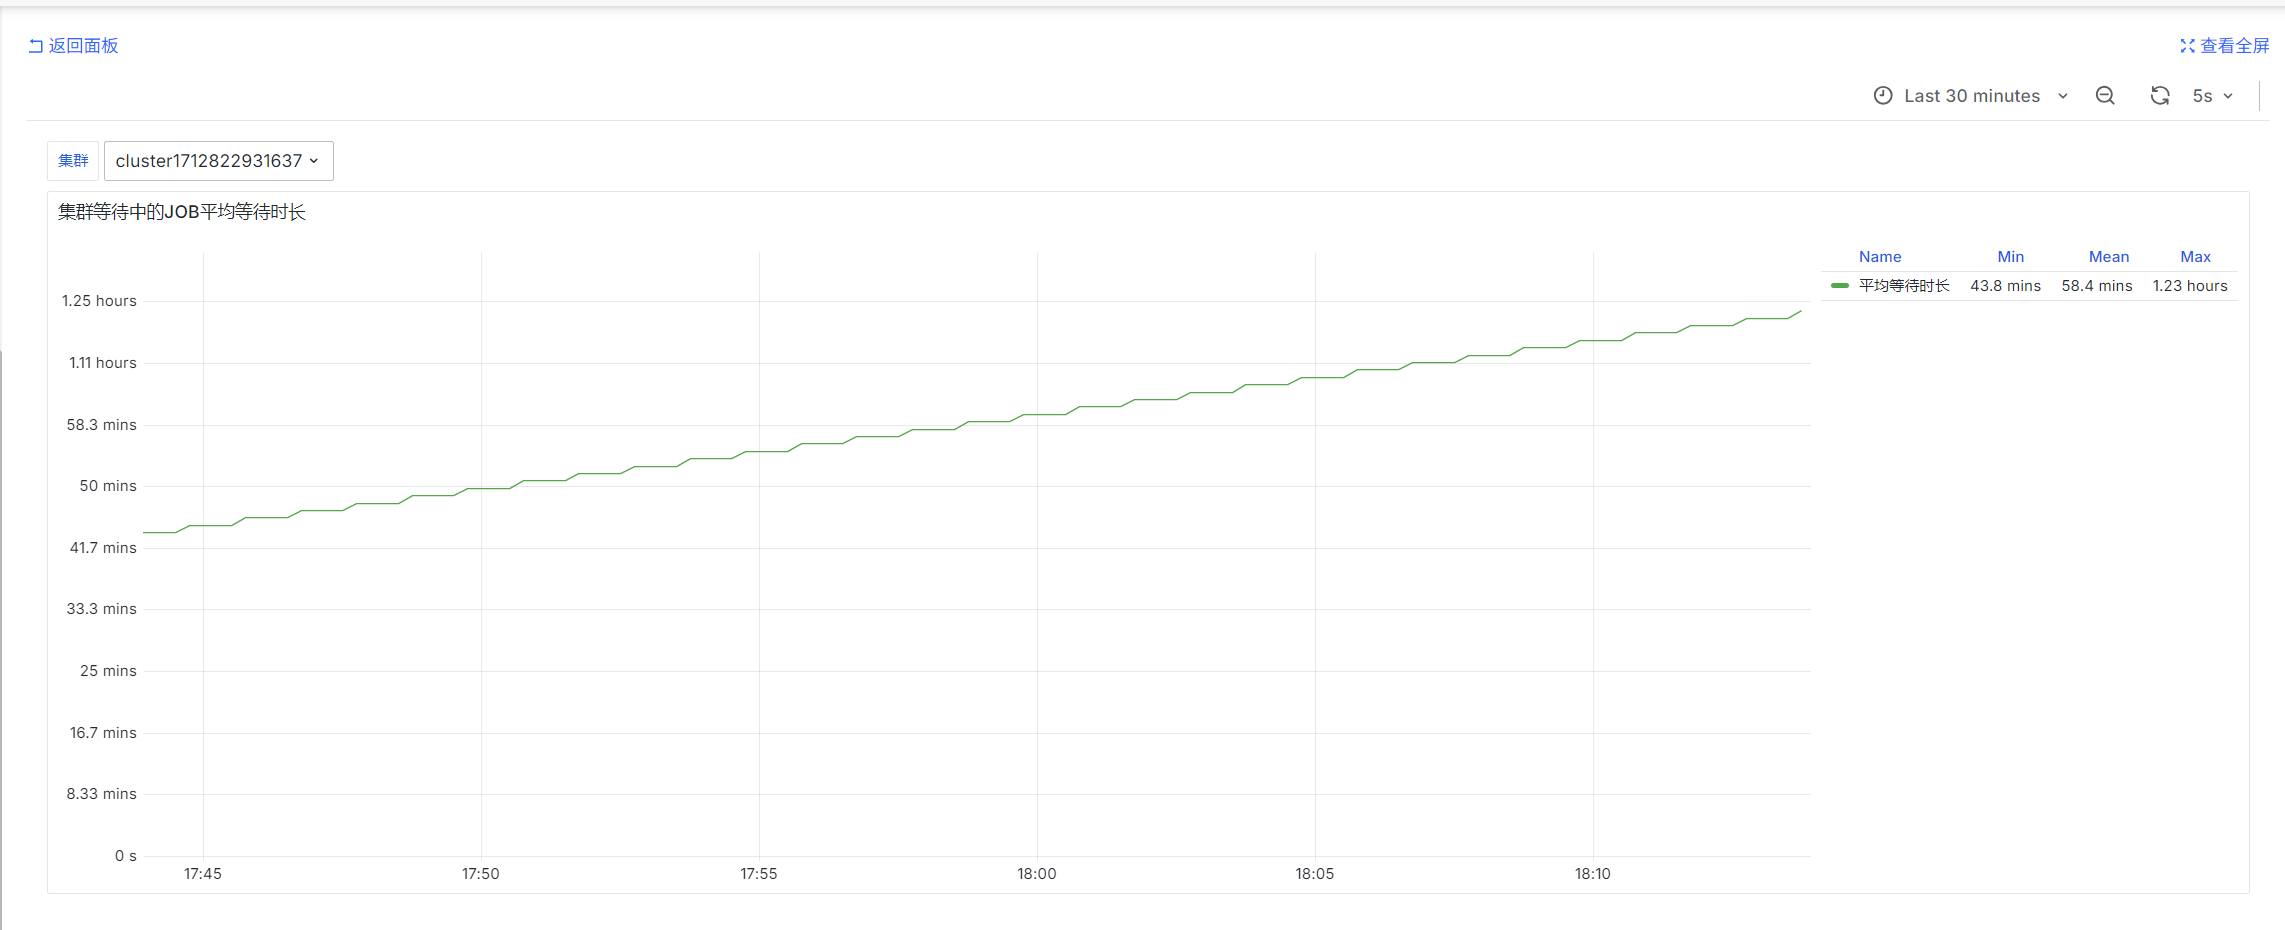
slurm_partition_jobs_pending_wait_time_total{csClusterId='$ClusterId'}
prometheus-slurm-exporter定期查询集群的等待中的job并统计等待时间,统计的是瞬时值
分区等待中的JOB平均等待时长
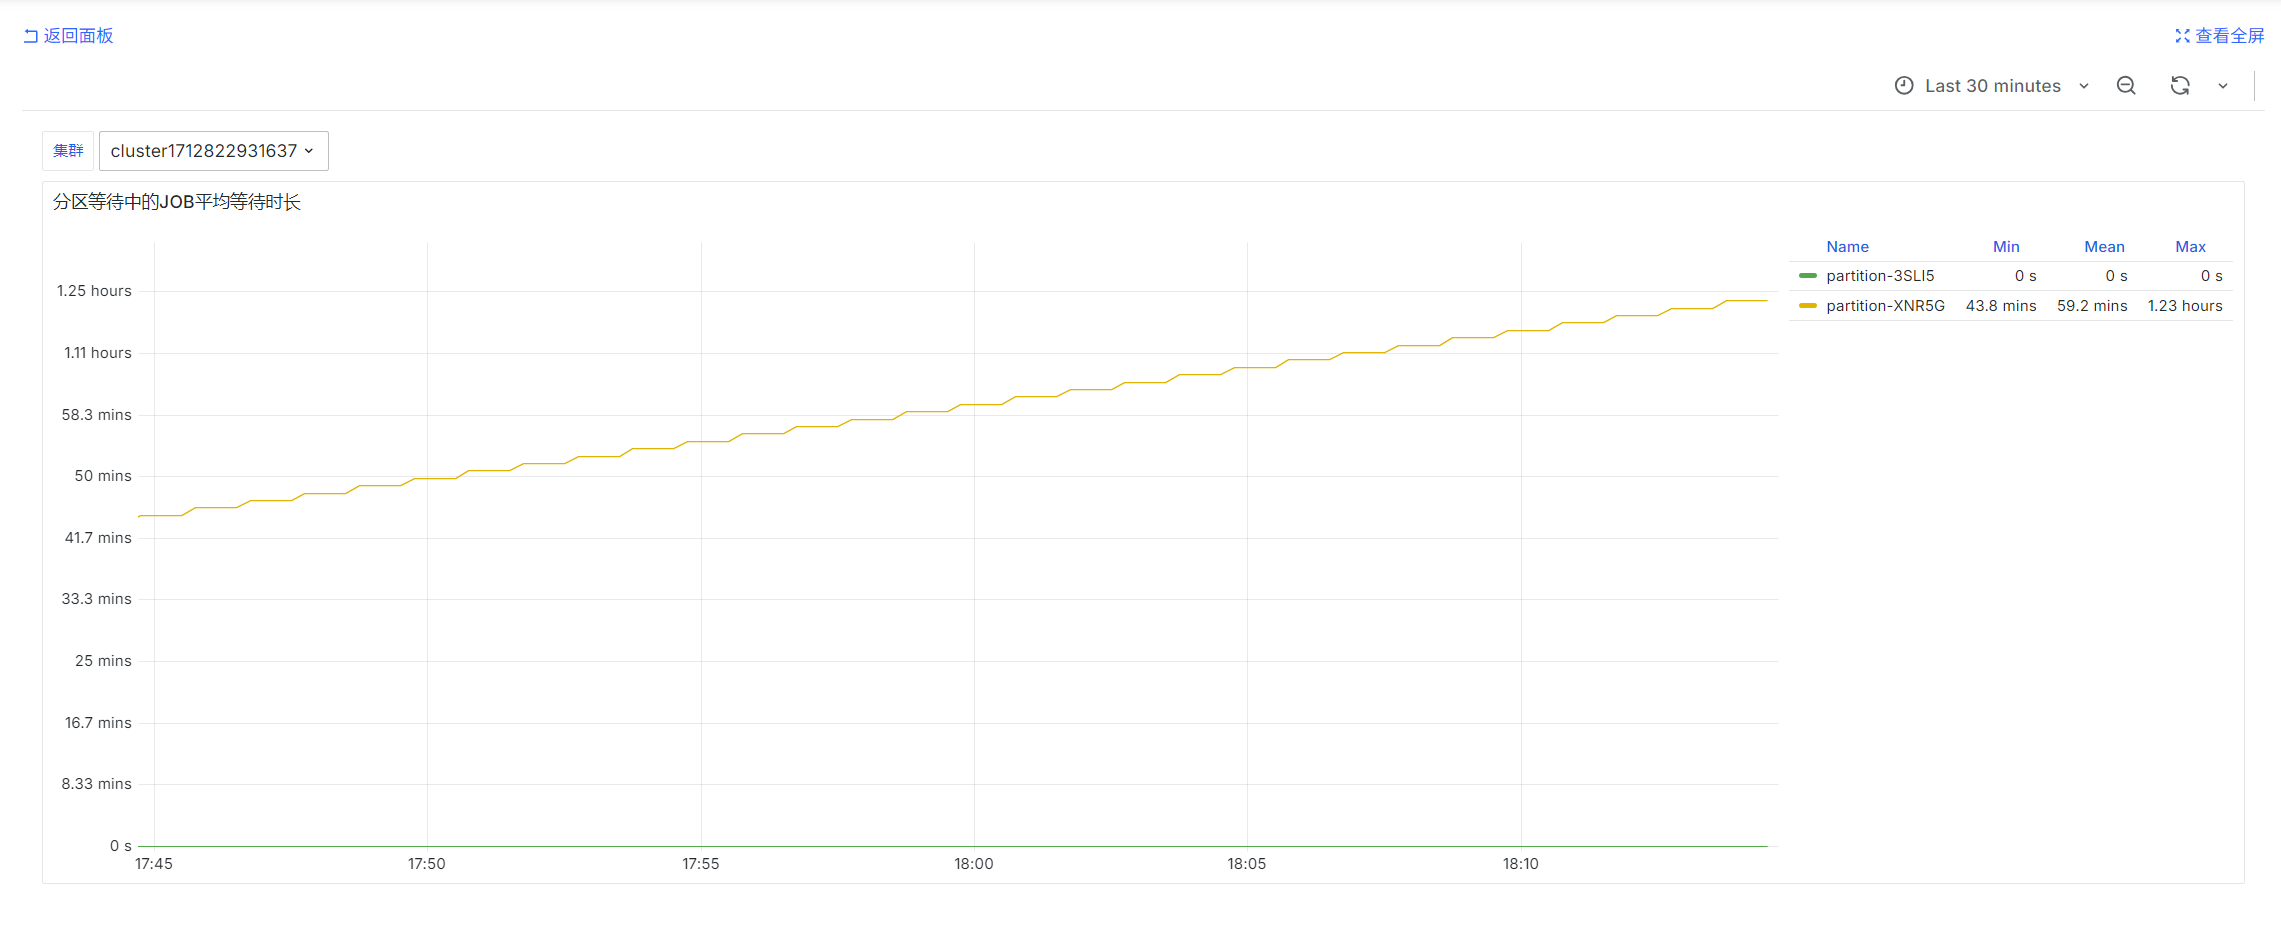
avg by (partition)(slurm_partition_jobs_pending_wait_time{csClusterId='$ClusterId'})
prometheus-slurm-exporter定期查询集群的等待中的job并统计等待时间,统计的是瞬时值
分区中已完成的JOB数量
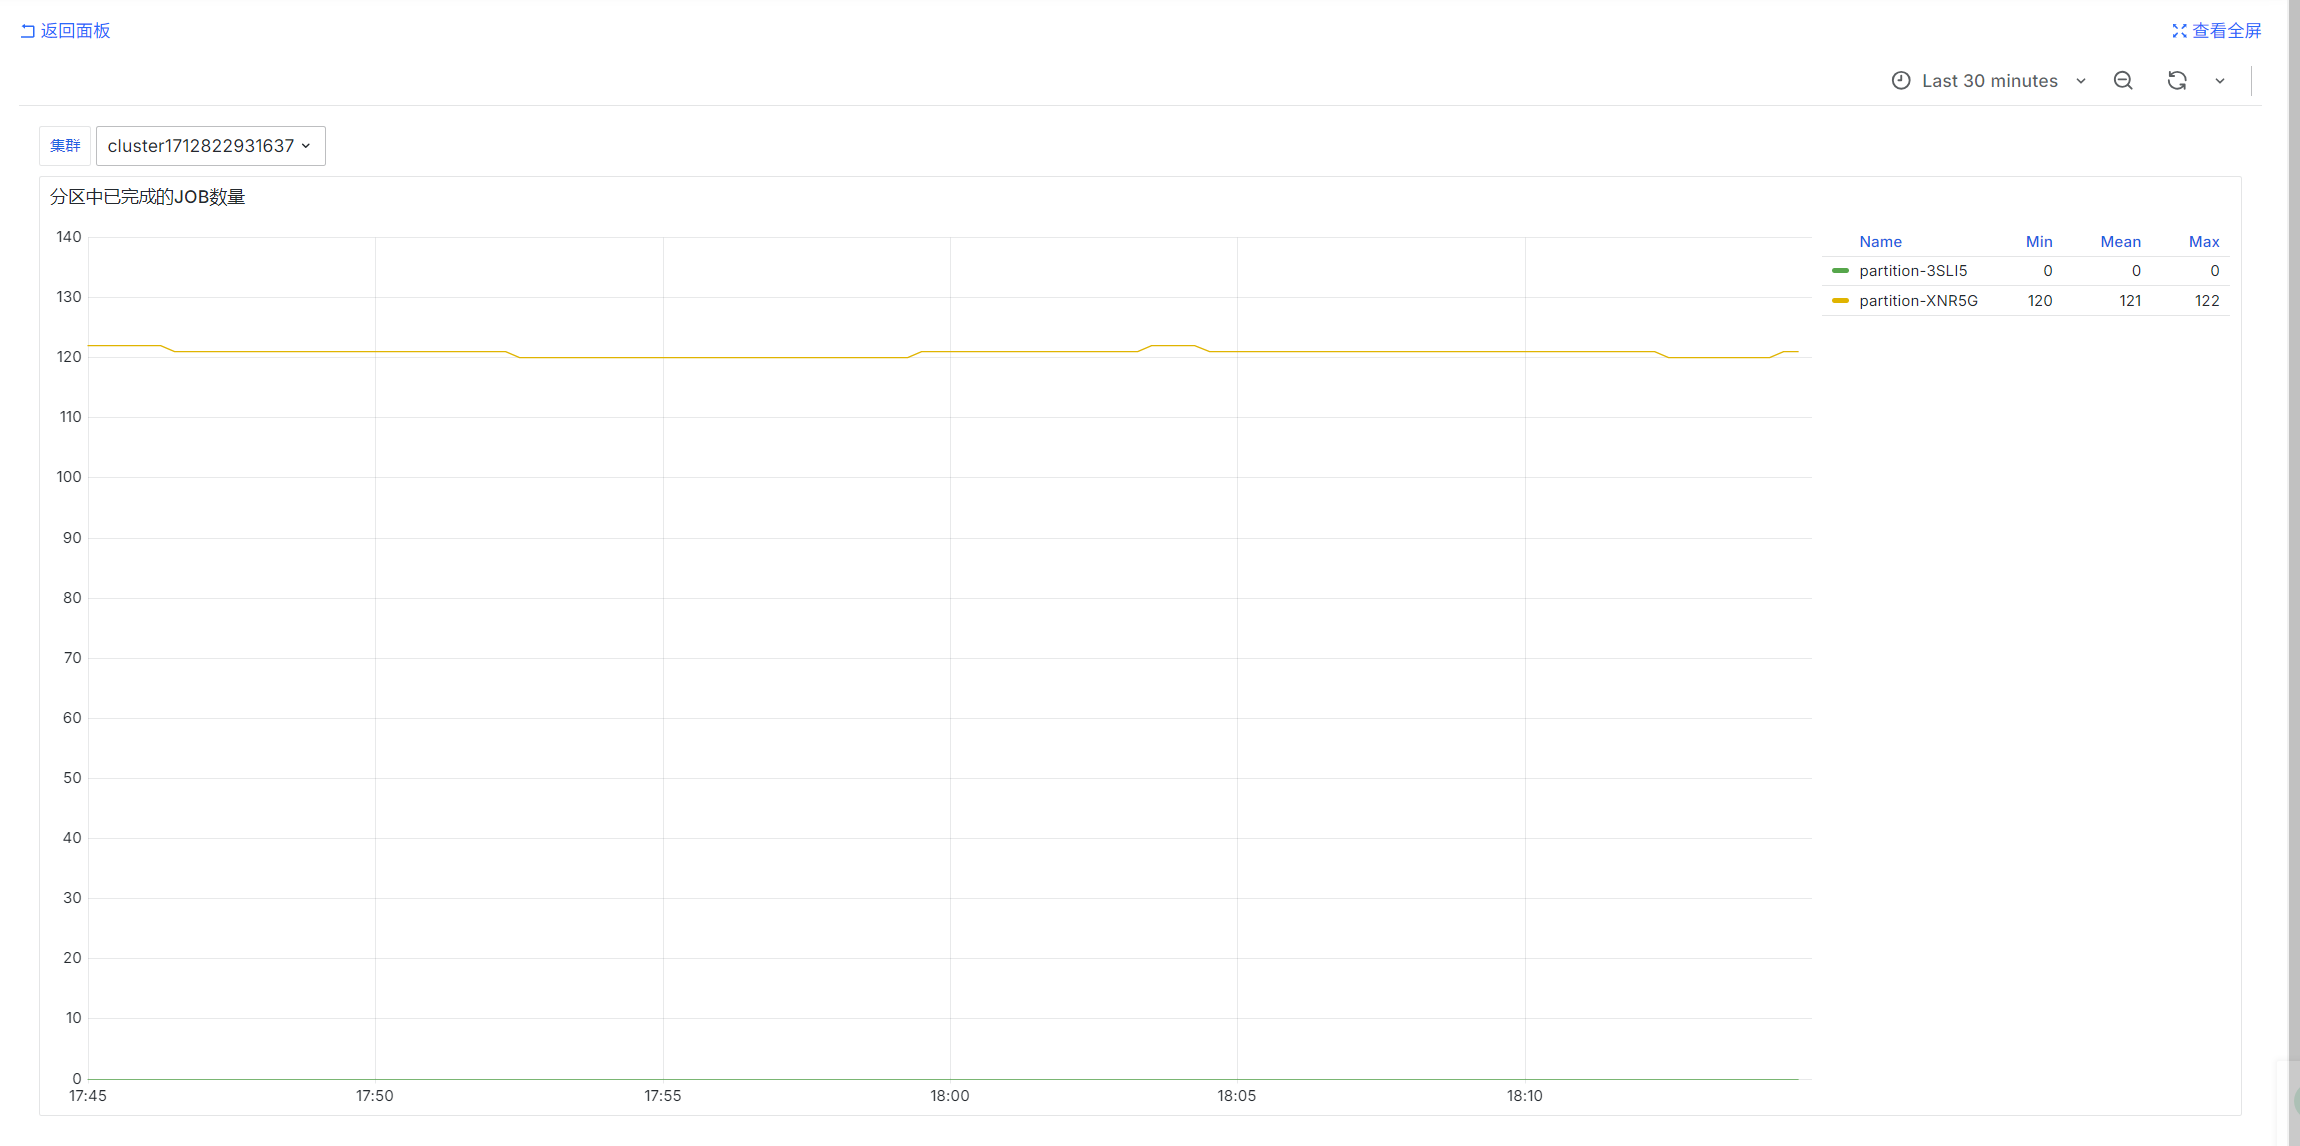
sum by (partition) (urd_job_state{cluster="$ClusterId", state='COMPLETED'})
urd定时查询每个集群的job并统计状态,统计的是瞬时值
运营总览
用户维度
集群模式的用户用量
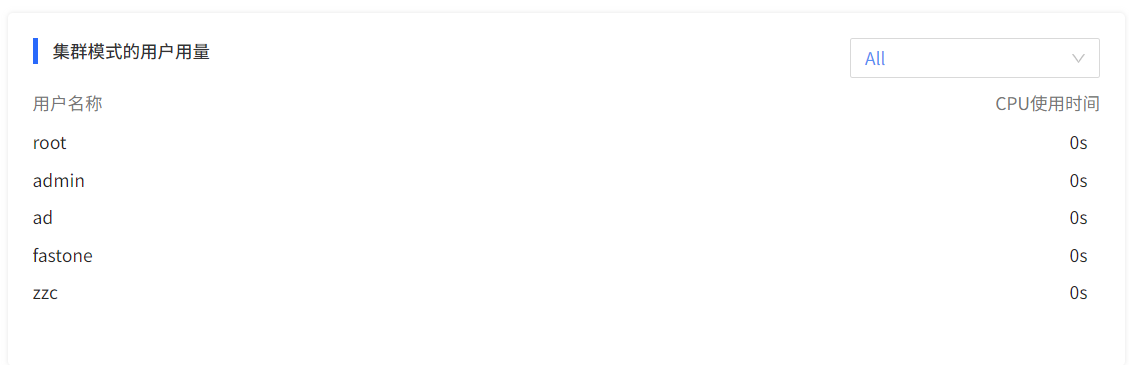
SELECT
username,
sum(usage) as usage
from user_usages
where end_time > ? and end_time < ? and (? = '' or cluster = ?)
group by username
order by usage desc